Boundary Connectivity
Boundary Connectivity (Guerra, 2013) quantifies the polarization of the network from the ties of the nodes that exist in group boundaries. A node is a boundary node if and only if it has one edge connecting to a different community and at least one edge connecting to a member of its own community which is not connected to any other community. Formally:
Then, boundary connectivity can be calculated with:
where we calculate, for each node \(v\) within the boundary set \(B\), the ratio of the internal edges of the node \(v\), \(d_i(v)\), to the total number of edges of the boundary node \(v\), \(d_i(v) + d_b(v)\).
Boundary connectivity, in its definition, contains a null model. The 0.5 subtraction assumes the boundary node will divide its edges equally between nodes in outside groups and nodes within its own group.
from netseg import boundary_connectivity
import igraph as ig
import matplotlib.pyplot as plt

import matplotlib.lines as mlines
import random
import numpy as np


%config InlineBackend.figure_format = 'retina'

COLORS = [
    '#2C486F',
    '#436796',
    '#5E8FAE',
    '#80BDD6',
    '#B1DDE0',
    "#fdf8e7",
    '#F8E5B2',
    '#F3CF63',
    '#E9A64C',
    '#E3843B',
    '#DA584E'
 ]

COLORS_NDIV = [
    '#FBE3C2',
    '#F2C88F',
    '#ECB27D',
    '#E69C6B',
    '#D37750',
    '#B9563F',
    '#92351E'
]


def make_symmetric_sbm(p_in, p_out, n_groups, nodes_per_group, membership, **kwargs):
    pref_matrix = [
        [p_in if i == j else p_out for j in range(n_groups)]
        for i in range(n_groups)
    ]
    block_sizes = [nodes_per_group] * n_groups
    g = ig.Graph.SBM(pref_matrix, block_sizes, **kwargs)

    g.vs['membership'] = membership

    return g
Boundary Nodes
Using its canonical definition (Guerra, 2013), netseg can detect boundary nodes in linear complexity. Crucially, a node fails to qualify as a boundary node if it connects to an external group but lacks a tie to an internal node within its own group. Formally, a node \(v_x \in G_i\) is excluded from the boundary set \(B_{i,j}\) under the following condition:
We can demonstrate this with the following:
from netseg import _get_boundary_nodes # This function is not part of the Public API, it is used within the metric function directly.
random.seed(2)
membership = [0 if i < 10 else 1 for i in range(20)]
g_simple = make_symmetric_sbm(0.4, 0.03, 2, 10, membership )
bnodes = _get_boundary_nodes(g_simple, np.array(membership))
g_simple_layout = g_simple.layout_kamada_kawai()

fig, axs = plt.subplots(1,2,figsize = (16,8))
ig.plot(g_simple,
        vertex_size = 36,
        edge_color = "black",
        edge_width = 0.6,
        vertex_color = [COLORS[9] if i in bnodes else COLORS[0] for i in range(len(membership))],
        layout = g_simple_layout,
        vertex_shape = ["triangle-down" if i == 0 else "square" for i in membership],
        target = axs[0],
        vertex_label = [i.index for i in g_simple.vs],
        vertex_label_dist = 1,
        vertex_label_angle = 0)

patch_bnode = mlines.Line2D([], [], color='none', marker='s',
                            markerfacecolor=COLORS[9], markeredgecolor='black',
                            markersize=10, label="Boundary Node")

patch_inode = mlines.Line2D([], [], color='none', marker='s',
                            markerfacecolor=COLORS[0], markeredgecolor='black',
                            markersize=10, label="Internal Node")

triangle = mlines.Line2D([], [], color='none', marker='v',
                         markerfacecolor="black", markeredgecolor='black',
                         markersize=10, label="Group I")

square = mlines.Line2D([], [], color='none', marker='s',
                         markerfacecolor="black", markeredgecolor='black',
                         markersize=10, label="Group II")


axs[0].legend(handles = [patch_bnode, patch_inode, triangle, square], loc = "lower right", title = "Nodal Attributes")


# Adding the extra node:

g_simple.add_vertex("20")
g_simple.add_edge(19,20)
g_simple.add_edge(20,5)
membership.append(1)

bnodes_extra = _get_boundary_nodes(g_simple, np.array(membership))
g_simple_layout_extended = [(x,y) for (x,y) in g_simple_layout]
g_simple_layout_extended.append((g_simple_layout_extended[-1][0] - .8, g_simple_layout_extended[-1][1] + .12))
g_simple_layout_extended = ig.Layout(g_simple_layout_extended)

ig.plot(g_simple,
        vertex_size = 36,
        edge_color = "black",
        edge_width = 0.6,
        vertex_color = [COLORS[9] if i in bnodes_extra else COLORS[0] for i in range(len(membership))],
        layout = g_simple_layout_extended,
        vertex_shape = ["triangle-down" if i == 0 else "square" for i in membership],
        target = axs[1],
        vertex_label = [i.index for i in g_simple.vs],
        vertex_label_dist = 1,
        vertex_label_angle = 0)

patch_bnode = mlines.Line2D([], [], color='none', marker='s',
                            markerfacecolor=COLORS[9], markeredgecolor='black',
                            markersize=10, label="Boundary Node")

patch_inode = mlines.Line2D([], [], color='none', marker='s',
                            markerfacecolor=COLORS[0], markeredgecolor='black',
                            markersize=10, label="Internal Node")

triangle = mlines.Line2D([], [], color='none', marker='v',
                         markerfacecolor="black", markeredgecolor='black',
                         markersize=10, label="Group I")

square = mlines.Line2D([], [], color='none', marker='s',
                         markerfacecolor="black", markeredgecolor='black',
                         markersize=10, label="Group II")


axs[1].legend(handles = [patch_bnode, patch_inode, triangle, square], loc = "lower right", title = "Nodal Attributes")

fig.suptitle("Boundary Node Detection", fontsize = 18)
plt.show()
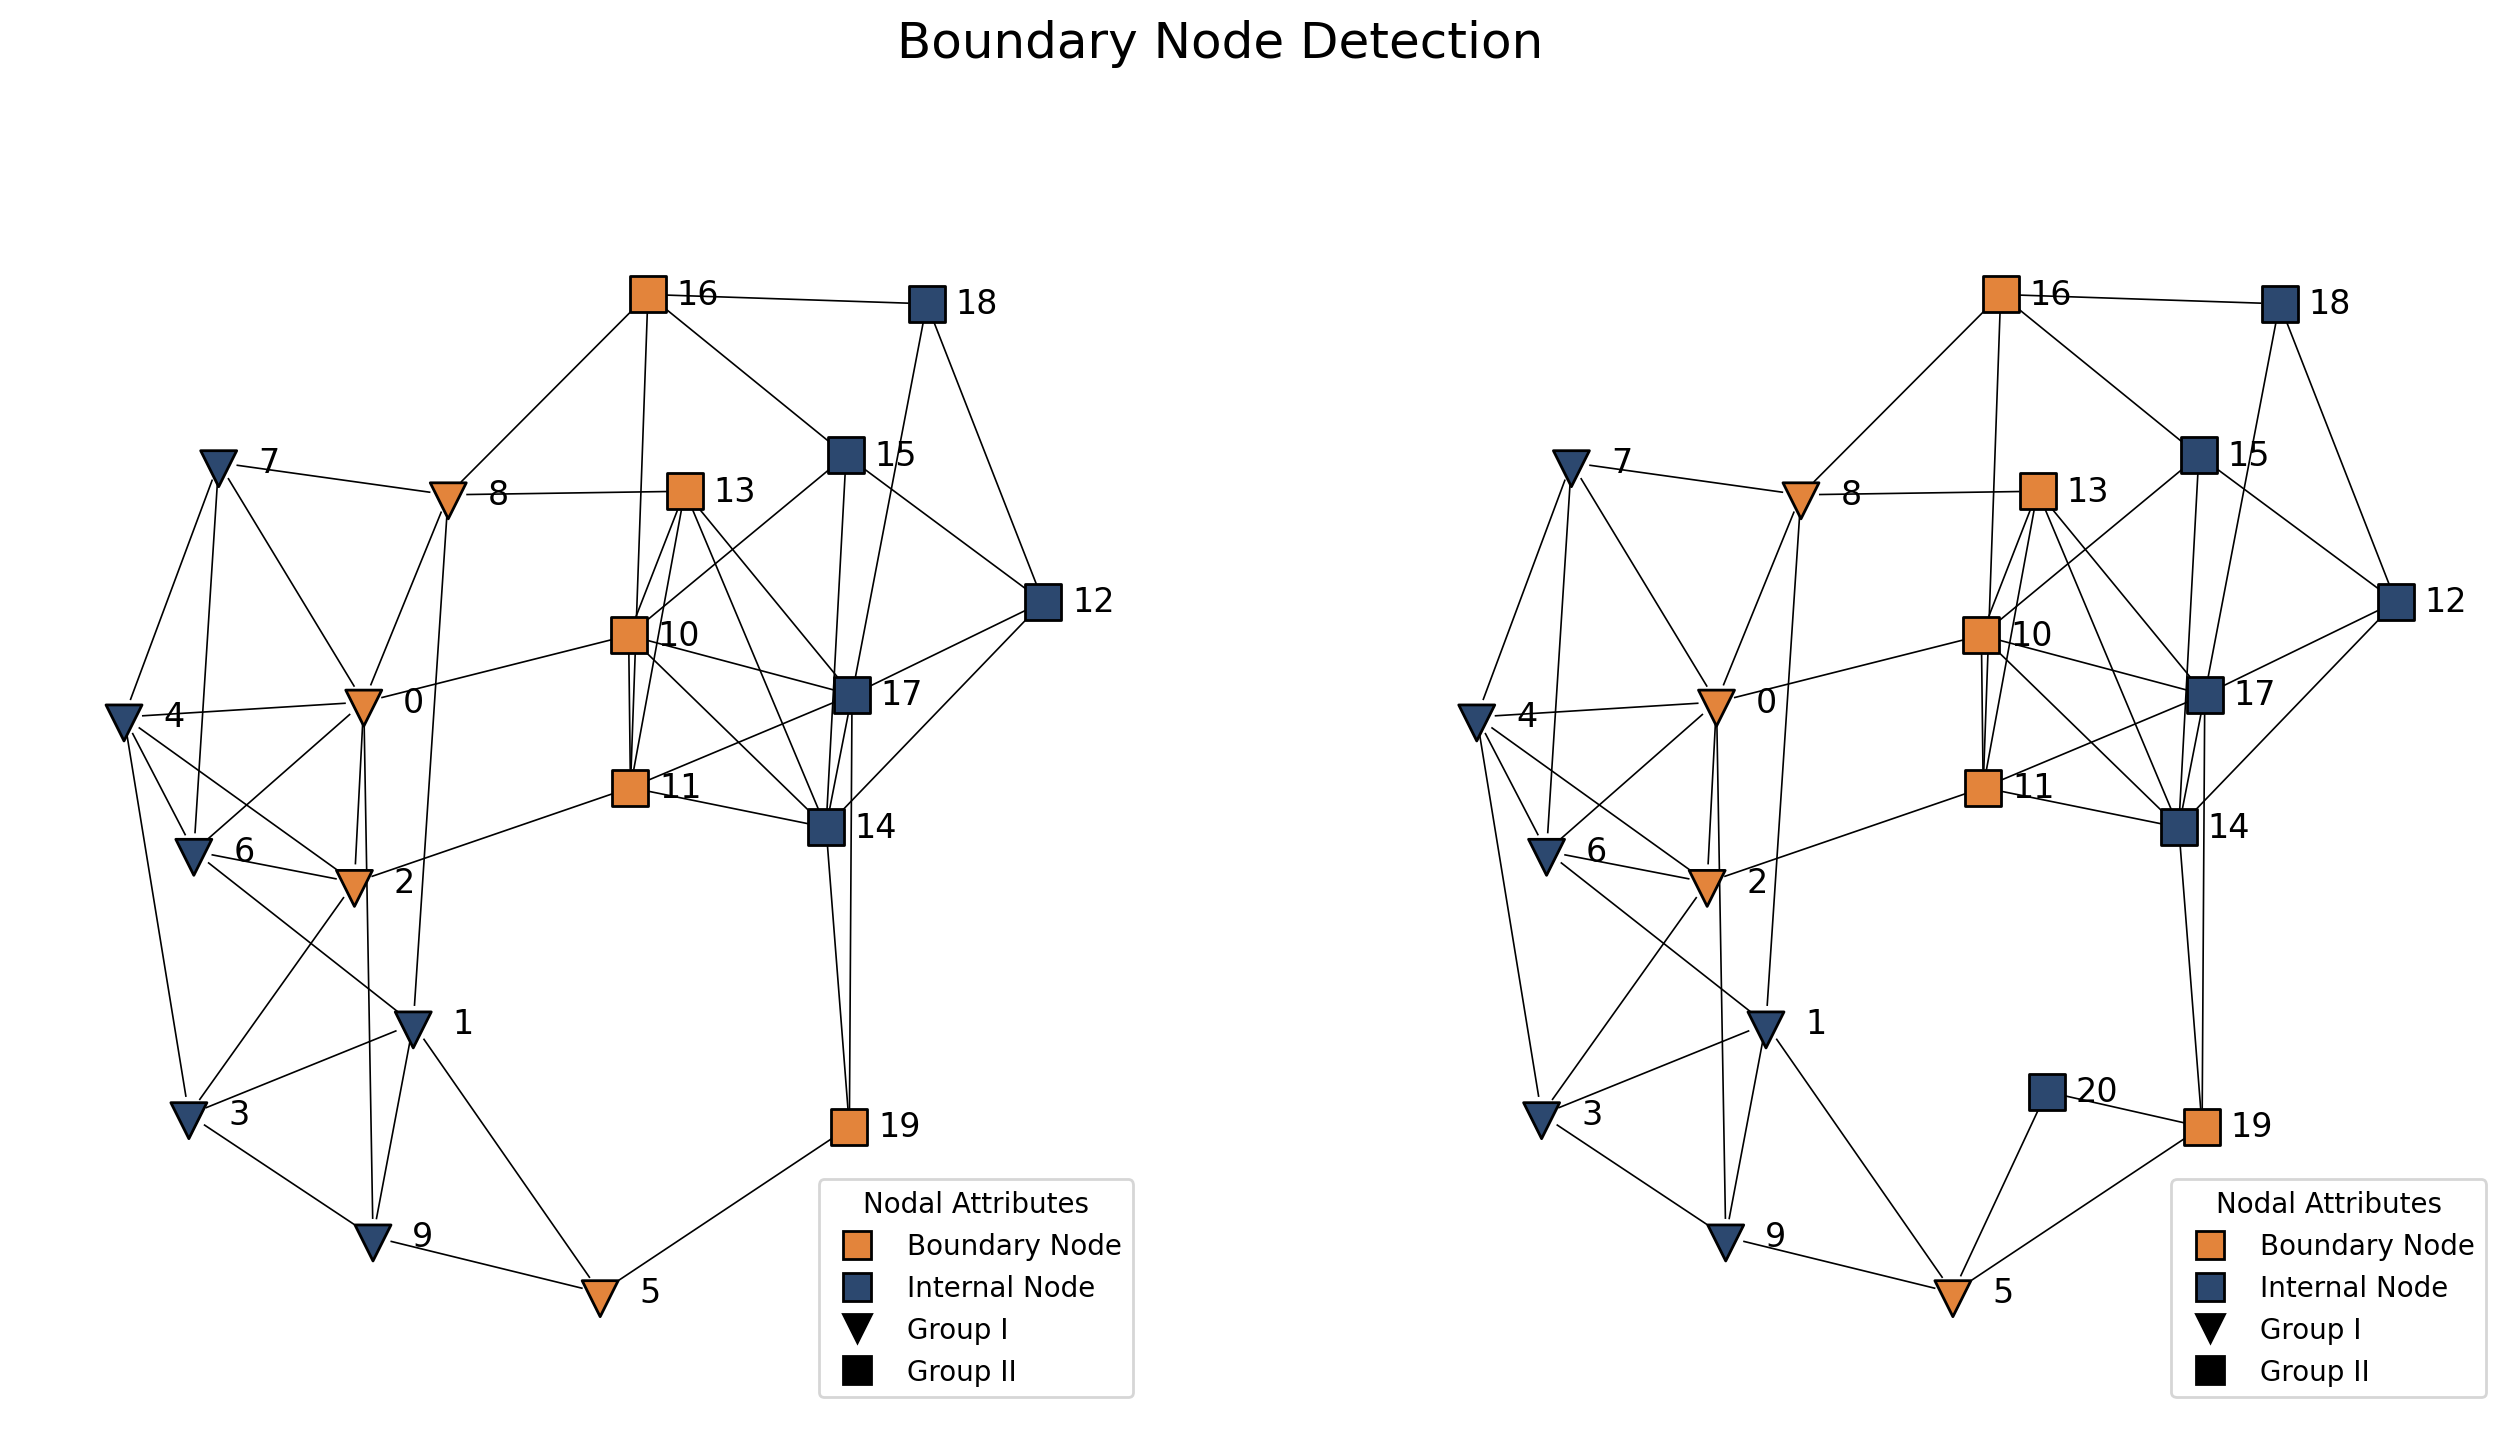
Although node 20 is connected to Group II, since it is not connected to an internal node from its own group, it does not satisfy the definition of a boundary node.
Basic Usage
The metric can easily be applied to the above graph with the following line of code:
bc_score = boundary_connectivity("membership", g_simple)
print(bc_score)
array([ 0, 2, 5, 8, 10, 11, 13, 16, 19])
Relaxed Definition
netseg allows a relaxed definition of a boundary node. In some graphs, finding boundary nodes might be challenging; in these cases, the function will return NA. In some contextual cases, relaxing the definition can also be useful. You can relax the definition by setting the relax argument to True. Under the relaxed definition, if a node is connected to a group other than its own and is also connected to at least one node from its own group—even if the node it is connected to is also a boundary node—it is considered a boundary node. An example is given below:
from netseg import _get_boundary_nodes_relaxed
# This function is not part of public API, if you want to use the relaxed
# definition of boundary nodes, set the relax parameter to True in
# boundary_connectivity function.
random.seed(2)
membership = [0 if i < 10 else 1 for i in range(20)]
g_simple = make_symmetric_sbm(0.4, 0.03, 2, 10, membership )
bnodes = _get_boundary_nodes_relaxed(g_simple, np.array(membership))
g_simple_layout = g_simple.layout_kamada_kawai()

fig, axs = plt.subplots(1,2,figsize = (16,8))
ig.plot(g_simple,
        vertex_size = 36,
        edge_color = "black",
        edge_width = 0.6,
        vertex_color = [COLORS[-1] if i in bnodes else COLORS[0] for i in range(len(membership))],
        layout = g_simple_layout,
        vertex_shape = ["triangle-down" if i == 0 else "square" for i in membership],
        target = axs[0],
        vertex_label = [i.index for i in g_simple.vs],
        vertex_label_dist = 1,
        vertex_label_angle = 0)

patch_bnode = mlines.Line2D([], [], color='none', marker='s',
                            markerfacecolor=COLORS[-1], markeredgecolor='black',
                            markersize=10, label="Boundary Node")

patch_inode = mlines.Line2D([], [], color='none', marker='s',
                            markerfacecolor=COLORS[0], markeredgecolor='black',
                            markersize=10, label="Internal Node")

triangle = mlines.Line2D([], [], color='none', marker='v',
                         markerfacecolor="black", markeredgecolor='black',
                         markersize=10, label="Group I")

square = mlines.Line2D([], [], color='none', marker='s',
                         markerfacecolor="black", markeredgecolor='black',
                         markersize=10, label="Group II")


axs[0].legend(handles = [patch_bnode, patch_inode, triangle, square], loc = "lower right", title = "Nodal Attributes")


# Adding the extra node:

g_simple.add_vertex("20")
g_simple.add_edge(19,20)
g_simple.add_edge(20,5)
membership.append(1)

bnodes_extra = _get_boundary_nodes_relaxed(g_simple, np.array(membership))
g_simple_layout_extended = [(x,y) for (x,y) in g_simple_layout]
g_simple_layout_extended.append((g_simple_layout_extended[-1][0] - .8, g_simple_layout_extended[-1][1] + .12))
g_simple_layout_extended = ig.Layout(g_simple_layout_extended)

ig.plot(g_simple,
        vertex_size = 36,
        edge_color = "black",
        edge_width = 0.6,
        vertex_color = [COLORS[-1] if i in bnodes_extra else COLORS[0] for i in range(len(membership))],
        layout = g_simple_layout_extended,
        vertex_shape = ["triangle-down" if i == 0 else "square" for i in membership],
        target = axs[1],
        vertex_label = [i.index for i in g_simple.vs],
        vertex_label_dist = 1,
        vertex_label_angle = 0)

patch_bnode = mlines.Line2D([], [], color='none', marker='s',
                            markerfacecolor=COLORS[-1], markeredgecolor='black',
                            markersize=10, label="Boundary Node")

patch_inode = mlines.Line2D([], [], color='none', marker='s',
                            markerfacecolor=COLORS[0], markeredgecolor='black',
                            markersize=10, label="Internal Node")

triangle = mlines.Line2D([], [], color='none', marker='v',
                         markerfacecolor="black", markeredgecolor='black',
                         markersize=10, label="Group I")

square = mlines.Line2D([], [], color='none', marker='s',
                         markerfacecolor="black", markeredgecolor='black',
                         markersize=10, label="Group II")


axs[1].legend(handles = [patch_bnode, patch_inode, triangle, square], loc = "lower right", title = "Nodal Attributes")

fig.suptitle("Boundary Node Detection\n(Relaxed Definition)", fontsize = 18)
plt.show()
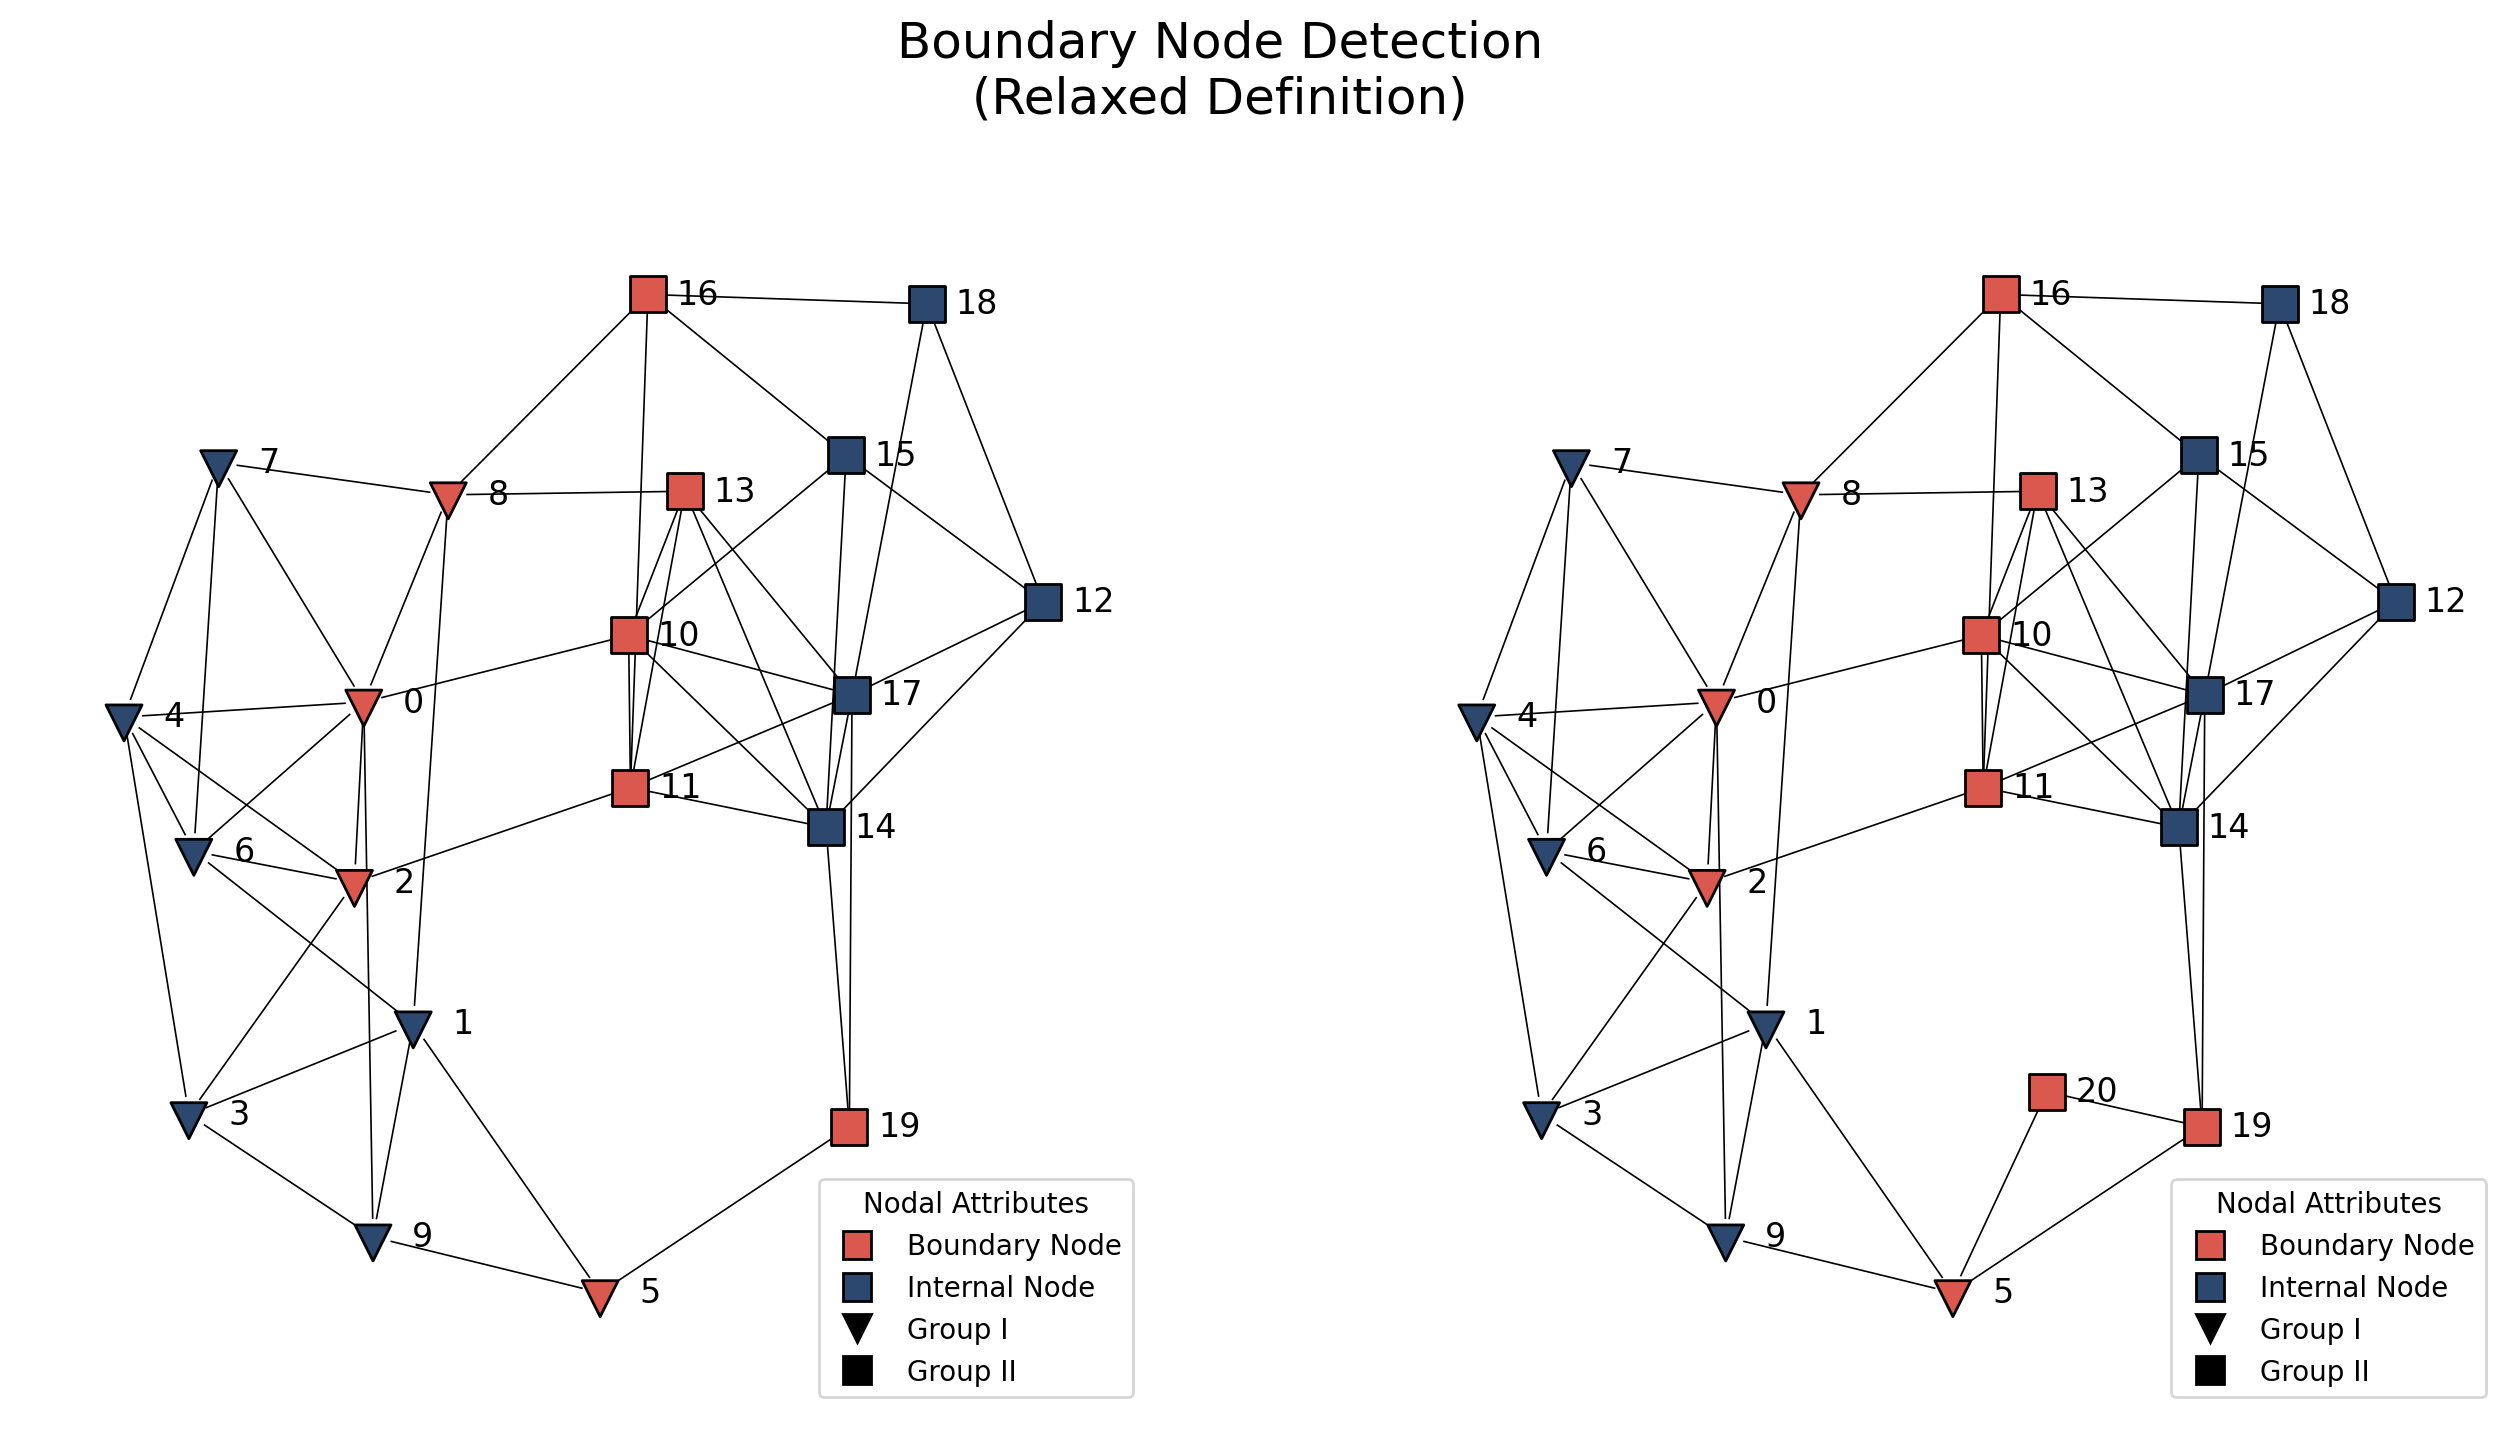
Now node 20 is considered as a boundary node.
Multiple Groups
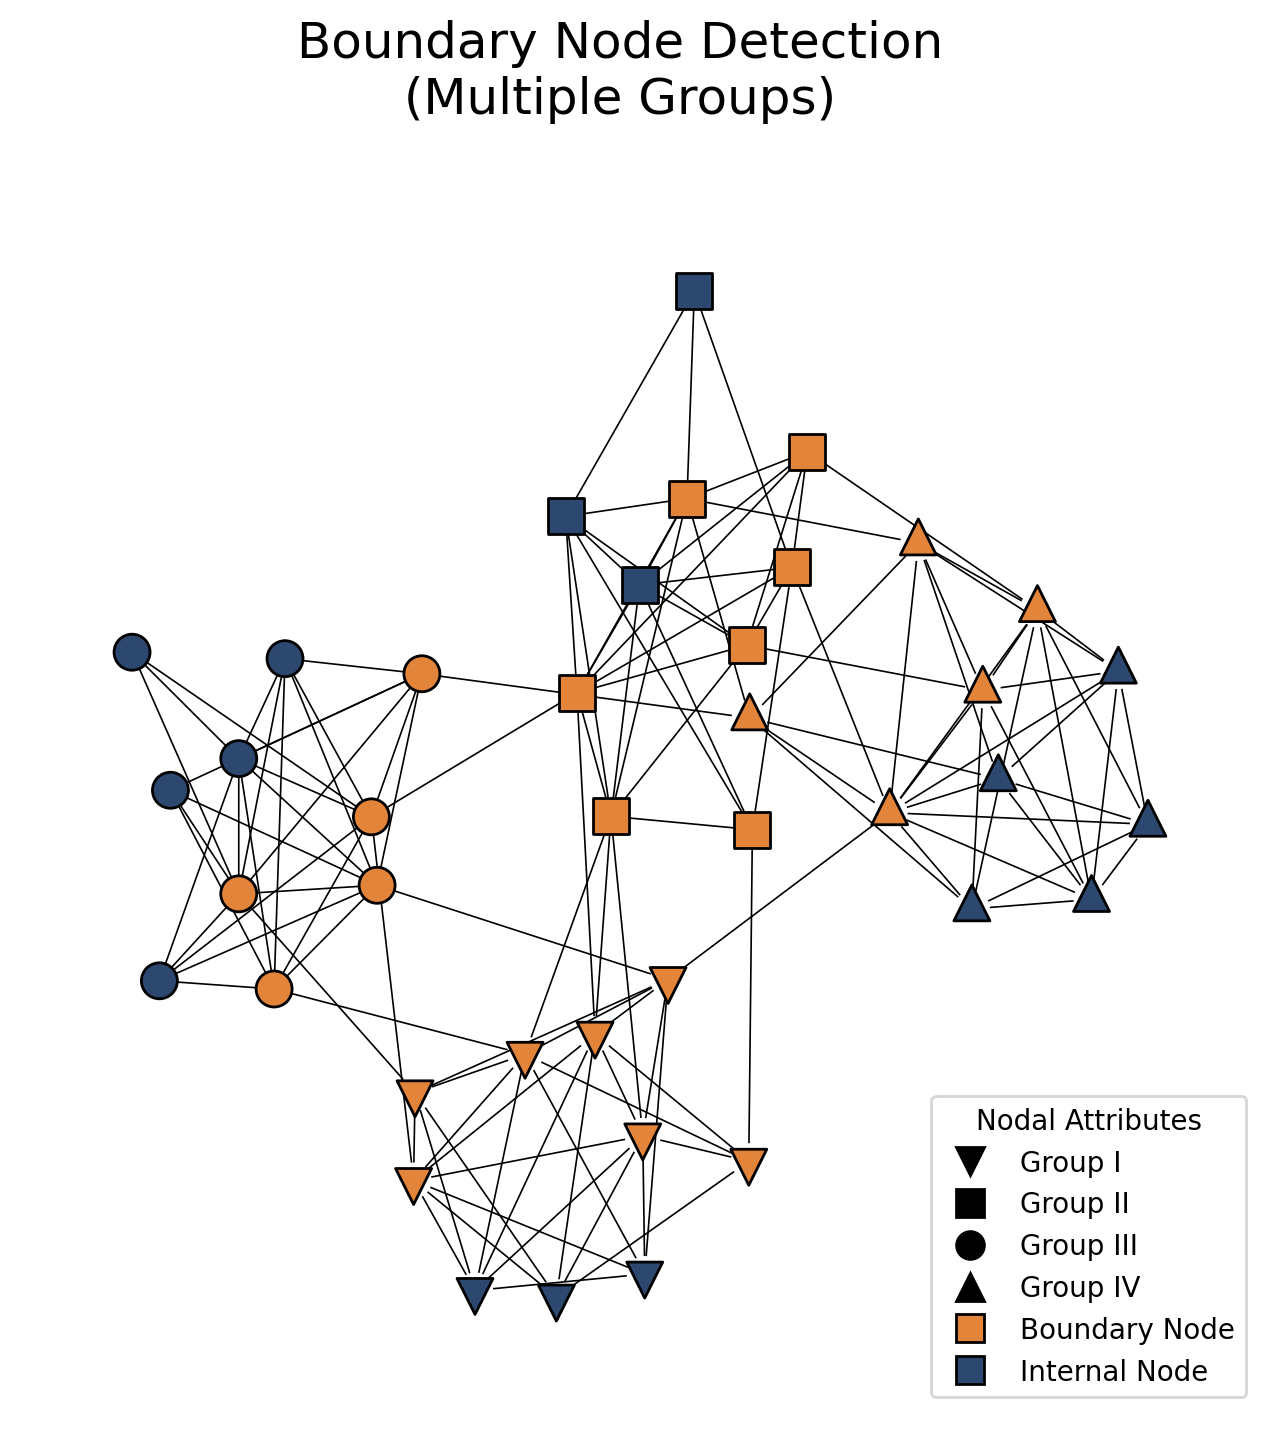
The definition of a boundary node is not restricted by the number of groups a network has. Since it can easily be extended, netseg allows boundary connectivity to be calculated across multiple groups.
random.seed(2)
membership_multi_group = ["foo"] * 10 + ["bar"] * 10 + ["baz"] * 10 + ["quux"] * 10


g_simple_multi_group = make_symmetric_sbm(0.7, 0.018, 4, 10, membership_multi_group )
bnodes_multi_group = _get_boundary_nodes(g_simple_multi_group, np.array(membership_multi_group))
g_simple_multi_group_layout = g_simple_multi_group.layout_kamada_kawai()
fig, ax = plt.subplots(figsize = (8,8))
shapes = {"foo":"triangle-up","bar":"square","baz":"circle","quux":"triangle-down"}
ig.plot(g_simple_multi_group,
        vertex_size = 36,
        edge_color = "black",
        edge_width = 0.6,
        layout = g_simple_multi_group_layout,
        vertex_color = [COLORS[9] if i in bnodes_multi_group else COLORS[0] for i in range(g_simple_multi_group.vcount())],
        vertex_shape = [shapes[i] for i in membership_multi_group],
        target = ax)

triangle = mlines.Line2D([], [], color='none', marker='v',
                         markerfacecolor="black", markeredgecolor='black',
                         markersize=10, label="Group I")

square = mlines.Line2D([], [], color='none', marker='s',
                         markerfacecolor="black", markeredgecolor='black',
                         markersize=10, label="Group II")
circle = mlines.Line2D([], [], color='none', marker='o',
                         markerfacecolor="black", markeredgecolor='black',
                         markersize=10, label="Group III")

triangle_up = mlines.Line2D([], [], color='none', marker='^',
                         markerfacecolor="black", markeredgecolor='black',
                         markersize=10, label="Group IV")

patch_bnode = mlines.Line2D([], [], color='none', marker='s',
                            markerfacecolor=COLORS[9], markeredgecolor='black',
                            markersize=10, label="Boundary Node")

patch_inode = mlines.Line2D([], [], color='none', marker='s',
                            markerfacecolor=COLORS[0], markeredgecolor='black',
                            markersize=10, label="Internal Node")

ax.legend(handles = [triangle, square, circle, triangle_up,patch_bnode, patch_inode], loc = "lower right", title = "Nodal Attributes")
fig.suptitle("Boundary Node Detection\n(Multiple Groups)", fontsize = 18)
plt.show()
Directed Networks
netseg extends this measure to directed networks via the required mode parameter. While a boundary node must always have a reciprocal connection with an external group, its internal connectivity requirement changes based on this mode. Since the mode parameter is context-dependent, netseg allows the use of the following for the mode parameter:
mode="in": The boundary node must receive an incoming tie from a purely internal node in its group.mode="out": The boundary node must send an outgoing tie to a purely internal node in its group.
random.seed(2)
membership = [0 if i < 100 else 1 for i in range(200)]
g_directed = make_symmetric_sbm(0.03, 0.0001, 2, 100, membership , directed = True)
layout_g_directed = g_directed.layout_kamada_kawai()
bnodes_directed = _get_boundary_nodes(g_directed, np.array(membership), mode = "out")
fig, axs = plt.subplots(1,2,figsize = (16,8))
ig.plot(g_directed,
        vertex_size = 24,
        edge_color = "gray",
        edge_width = 0.4,
        vertex_color = [COLORS[9] if i in bnodes_directed else COLORS[0] for i in range(len(membership))],
        layout = layout_g_directed,
        vertex_shape = ["triangle-down" if i == 0 else "square" for i in membership],
        target = axs[0],
        edge_arrow_size = 6.5)

patch_bnode = mlines.Line2D([], [], color='none', marker='s',
                            markerfacecolor=COLORS[9], markeredgecolor='black',
                            markersize=10, label="Boundary Node")

patch_inode = mlines.Line2D([], [], color='none', marker='s',
                            markerfacecolor=COLORS[0], markeredgecolor='black',
                            markersize=10, label="Internal Node")

triangle = mlines.Line2D([], [], color='none', marker='v',
                         markerfacecolor="black", markeredgecolor='black',
                         markersize=10, label="Group I")

square = mlines.Line2D([], [], color='none', marker='s',
                         markerfacecolor="black", markeredgecolor='black',
                         markersize=10, label="Group II")


axs[0].legend(handles = [patch_bnode, patch_inode, triangle, square], loc = "lower right", title = "Nodal Attributes")

g_directed.add_edge(62,127)

bnodes_directed = _get_boundary_nodes(g_directed, membership = np.array(g_directed.vs['membership']), mode = "in")
ig.plot(g_directed,
        vertex_size = 24,
        edge_color = "gray",
        edge_width = 0.4,
        vertex_color = [COLORS[9] if i in bnodes_directed else COLORS[0] for i in range(len(membership))],
        layout = layout_g_directed,
        vertex_shape = ["triangle-down" if i == 0 else "square" for i in membership],
        target = axs[1],
        edge_arrow_size = 6.5)

axs[1].legend(handles = [patch_bnode, patch_inode, triangle, square], loc = "lower right", title = "Nodal Attributes")
plt.show()
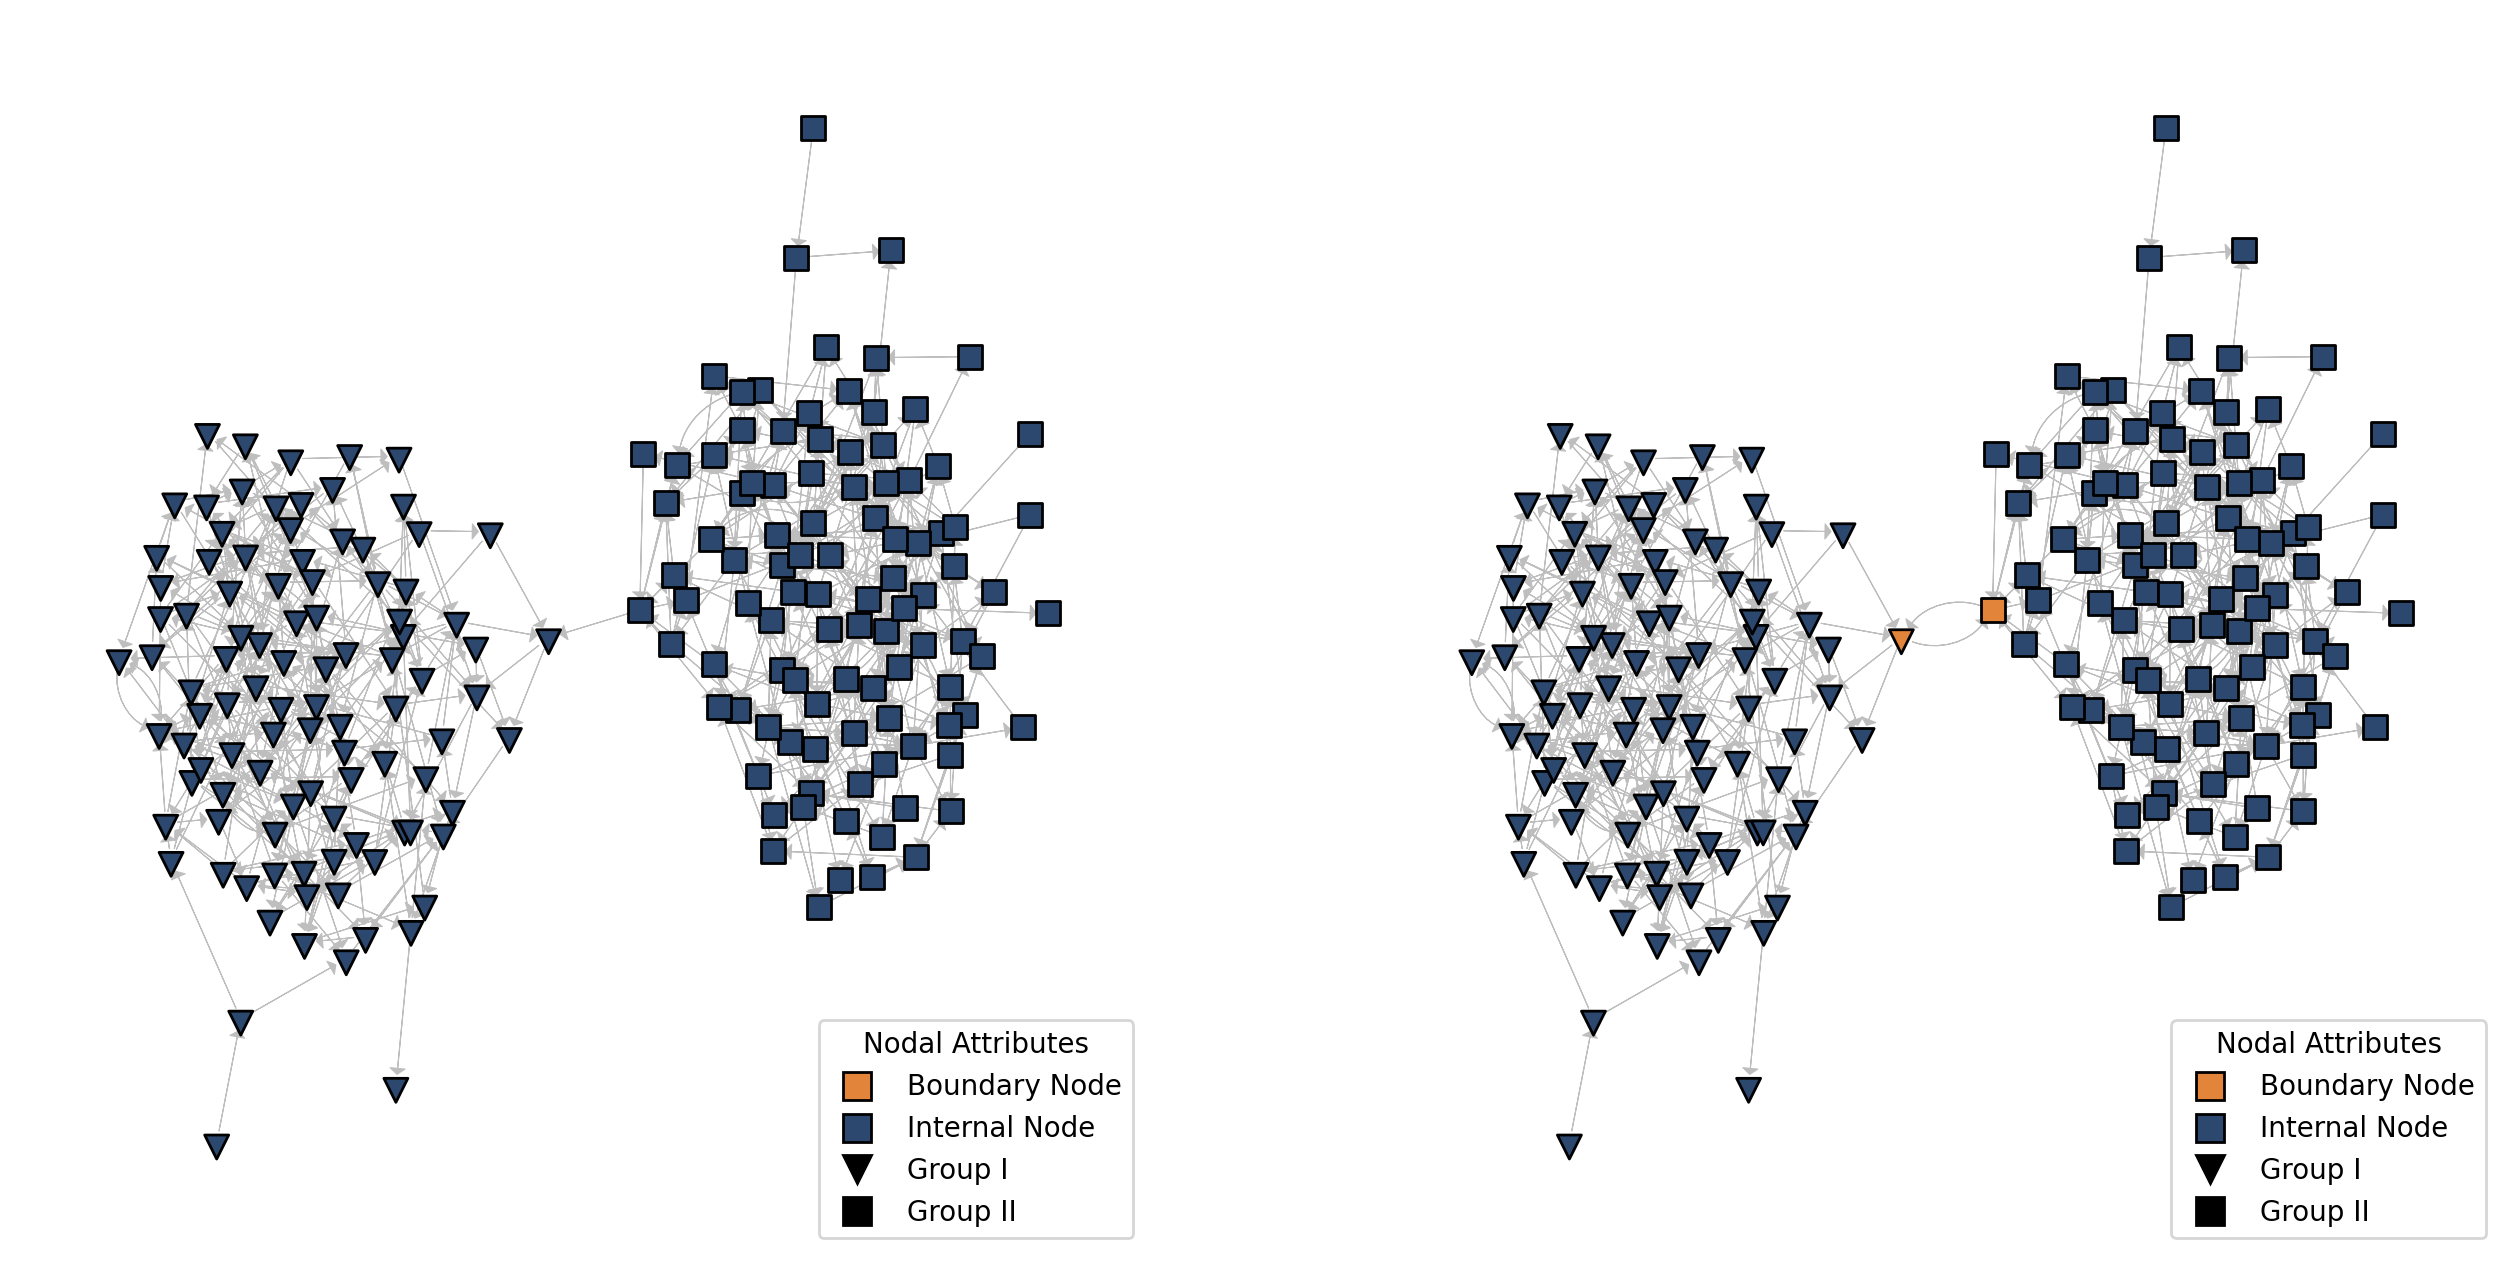
Since there are no reciprocal relationships in the above graph, no node is considered a boundary node. It is possible to add this relationship and create a boundary node manually, as can be seen in the plot on the right.
Please note that boundary connectivity is only concerned with nodes within the boundary. Especially for directed networks where there are no reciprocal ties between the boundary nodes, it can indicate integration.
Example
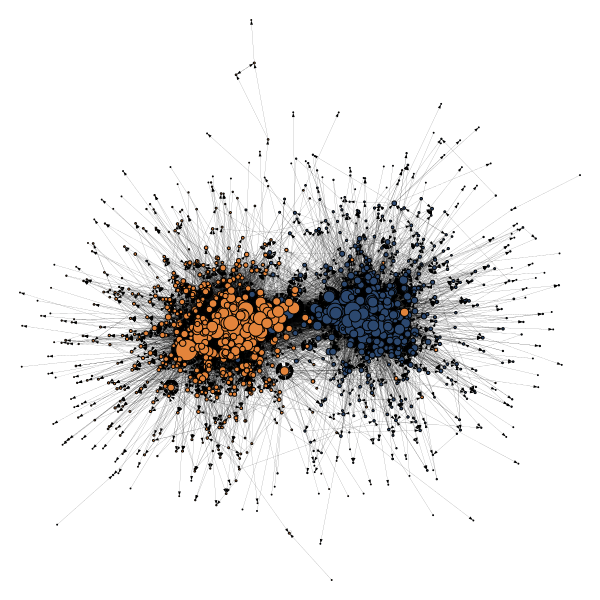
We are measuring the boundary connectivity on a directed network of hyperlinks between weblogs on US politics, recorded in 2005 by Adamic and Glance. Dataset can be found in here. We are only considering the giant component that is weakly connected.
polblogs_network = ig.Graph.Read_GML('../assets/polblogs_data/polblogs.gml')
del polblogs_network.vs['label']
polblogs_network_giant = polblogs_network.components(mode = "weak").giant()
/var/folders/tm/qy0kswk97qnbl_nzsfct4g7w0000gn/T/ipykernel_214/2197289519.py:1: RuntimeWarning: One or more unknown entities will be returned verbatim (&). Location: src/io/gml.c:149
  polblogs_network = ig.Graph.Read_GML('../assets/polblogs_data/polblogs.gml')
ig.plot(polblogs_network_giant,
        layout = polblogs_network_giant.layout_fruchterman_reingold(),
        vertex_size = [i ** .5 for i in polblogs_network_giant.degree()],
        edge_color = "black",
        edge_width = .1,
        vertex_color = [COLORS[9] if i == 1 else COLORS[0] for i in polblogs_network_giant.vs['value']],
        edge_arrow_size = .3)
polblog_bc_score = boundary_connectivity("value", polblogs_network_giant, mode = "out")
print(polblog_bc_score)
0.32384414162956876
References
Adamic, Lada A., and Natalie Glance. “The political blogosphere and the 2004 US election: divided they blog.” Proceedings of the 3rd international workshop on Link discovery. 2005.
Guerra, Pedro, et al. “A measure of polarization on social media networks based on community boundaries.” Proceedings of the international AAAI conference on web and social media. Vol. 7. No. 1. 2013.