Mixing Matrix and Benchmarks
from netseg import freeman
import numpy as np
Different Ways to Use netseg
Most of the measures in netseg can directly be used with a mixing matrix. These measures have an argument that accept a mixing matrix as total edge counts across groups. For example,
membership = [0 if i < 100 else 1 for i in range(200)]
freeman(membership= membership, mixing_matrix= np.array([[140, 16],[16,140]]))
np.float64(0.7948717948717948)
Benchmarks
netseg provides scalable, easy-to-use segregation measures for computational social scientists. By leveraging NumPy’s vectorization and igraph’s C backend, the package builds upon foundational community implementations to optimize performance for large networks. It consolidates several individually developed metrics into a unified toolkit.
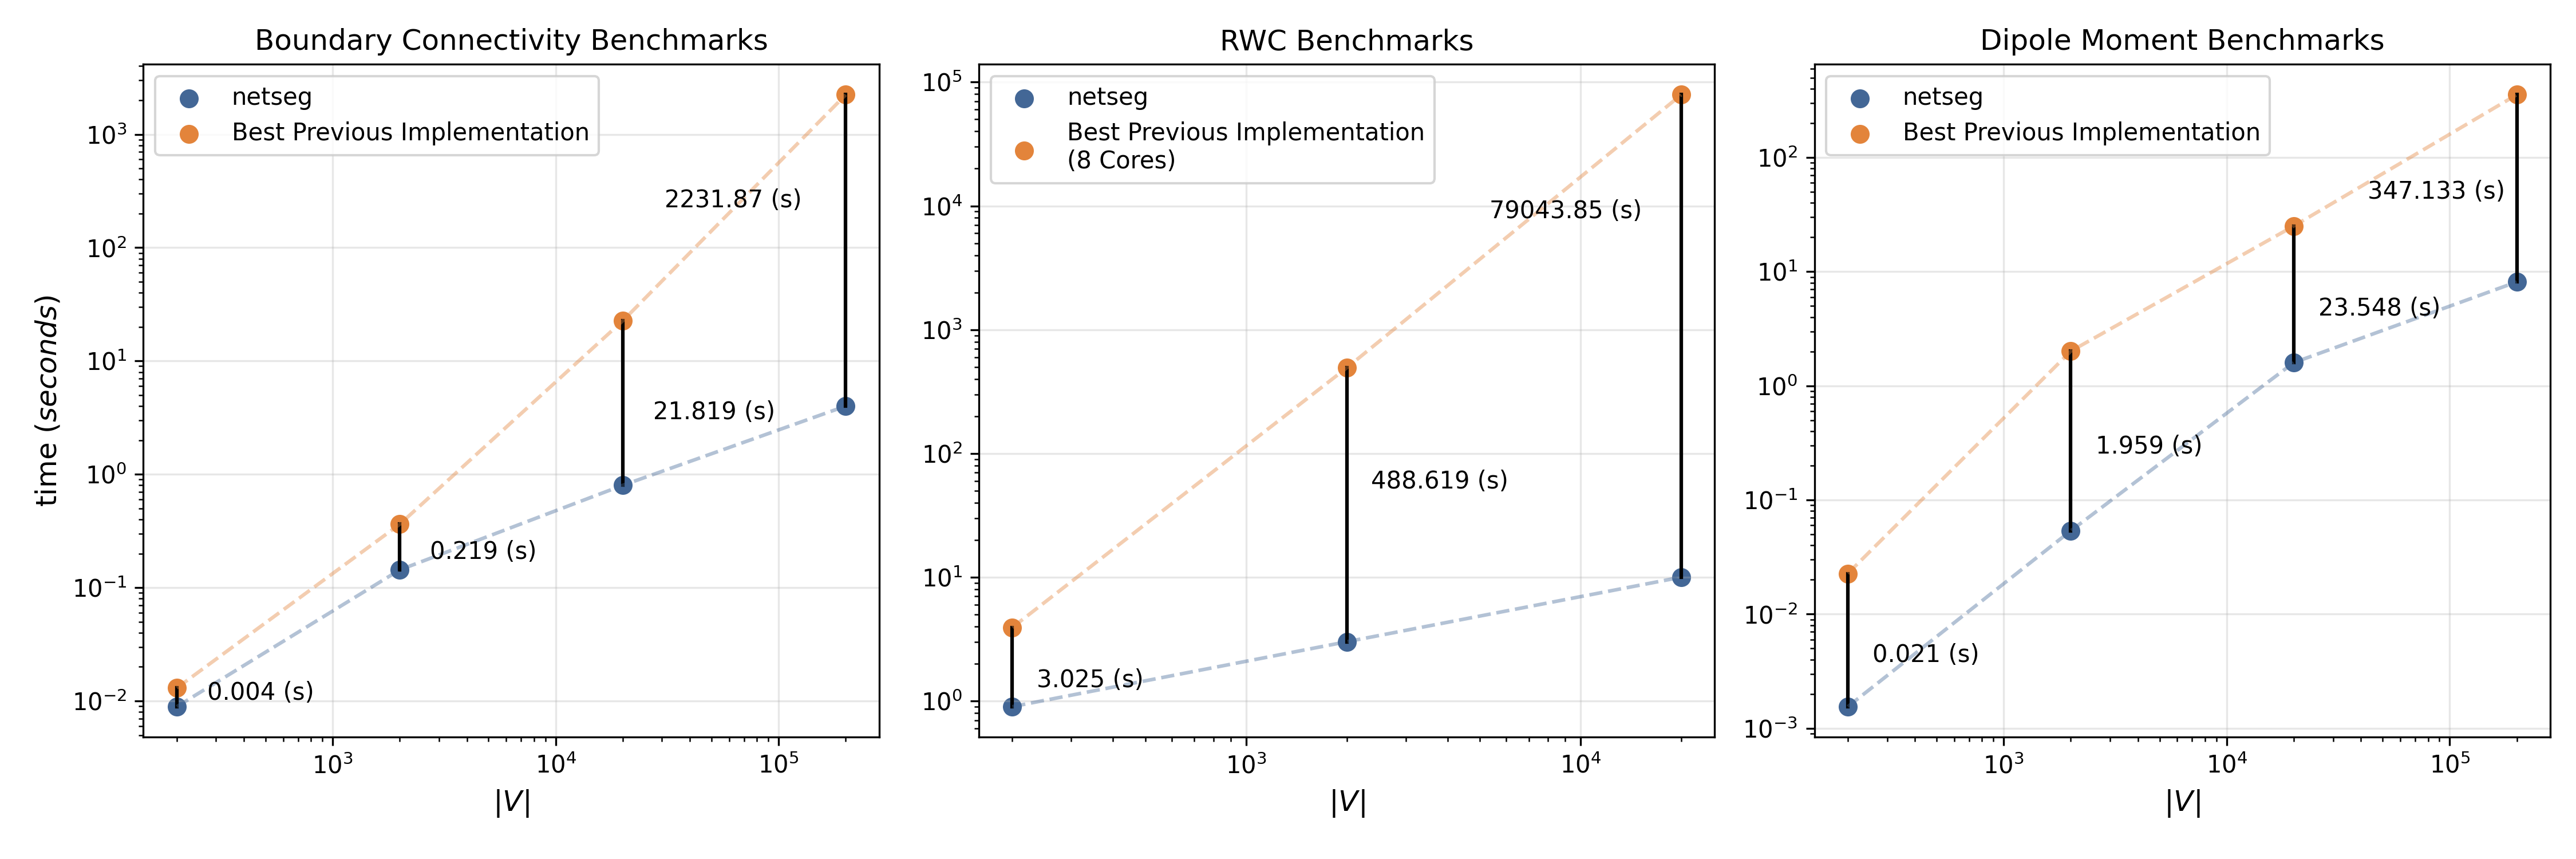
The benchmarks below show the scaling of netseg alongside the existing packages that inspired this work. It is important to notice that only challenging metrics are considered since some of the metrics are trivial and require obtaining a mixing matrix, which does not require extensive optimization and all of the Python and R packages, more or less, will have similar times if they are develop with care. For assortativity coefficient, netseg will perform better than networkx but igraph will perform orders of magnitude better than netseg.
All results were obtained on a MacBook Air M3. Times are reported in seconds. Python benchmarks were timed using perf_counter and R benchmarks were timed using system.time(). Note that if you perform these tests yourself, although the difference ratio will be the same more or less, the slope of the curve might change between time-points according to your L2 cache size.
For the Random Walk Controversy (RWC) metric, the number of simulations was set to 10,000. For both RWC and Dipole Moment, k_top was set to .3% of the total number of nodes in the graph. Finally, for the previous best implementation of RWC, the number of parallel workers was set to 8.