Dipole Moment
Dipole Polarization (Morales et al., 2015) measures the polarization of an opinion distribution, drawing inspiration from the electric dipole moment. It evaluates polarization based on two main factors: how evenly the population is split between two opposing views, and how extreme the distance is between those contrasting views.
Assuming node opinions are distributed continuously on a scale from \(-1\) (negative pole) to \(1\) (positive pole), we calculate the relative population sizes of the positive and negative groups (\(A^+\) and \(A^-\)), as well as their respective average opinions, referred to as “gravity centers” (\(gc^+\) and \(gc^-\)).
First, the normalized difference in population size is defined as:
Then, the normalized distance between the two average opinions (the pole distance) is calculated as:
Finally, the Dipole Polarization index \(\mu\) is calculated with:
This index naturally bounds between \(0\) and \(1\). The \((1 - \Delta A)\) term ensures that polarization is highest only when the network is divided into two groups of the exact same size (\(\Delta A = 0\)). The \(d\) multiplier dictates that these evenly matched groups must also hold completely conflicting, extreme opinions to achieve maximum polarization (\(d = 1\)). If the network shares a consensus or the groups are not ideologically separated, the pole distance is \(0\), resulting in zero polarization.
When estimating how opinions spread through a network, we look at how individuals (nodes) update their views based on their social connections.
In the original model proposed by Morales et al. (2015), a person’s new opinion is calculated strictly as the average of their incoming neighbors’ opinions. It explicitly ignores their own previous opinion:
where \(A_{ij}\) represents the network connection from node \(j\) to node \(i\), and \(k_i^{in}\) is the total number of incoming connections (indegree). To provide more flexibility in modeling social dynamics, the netseg allows including the self opinion also.
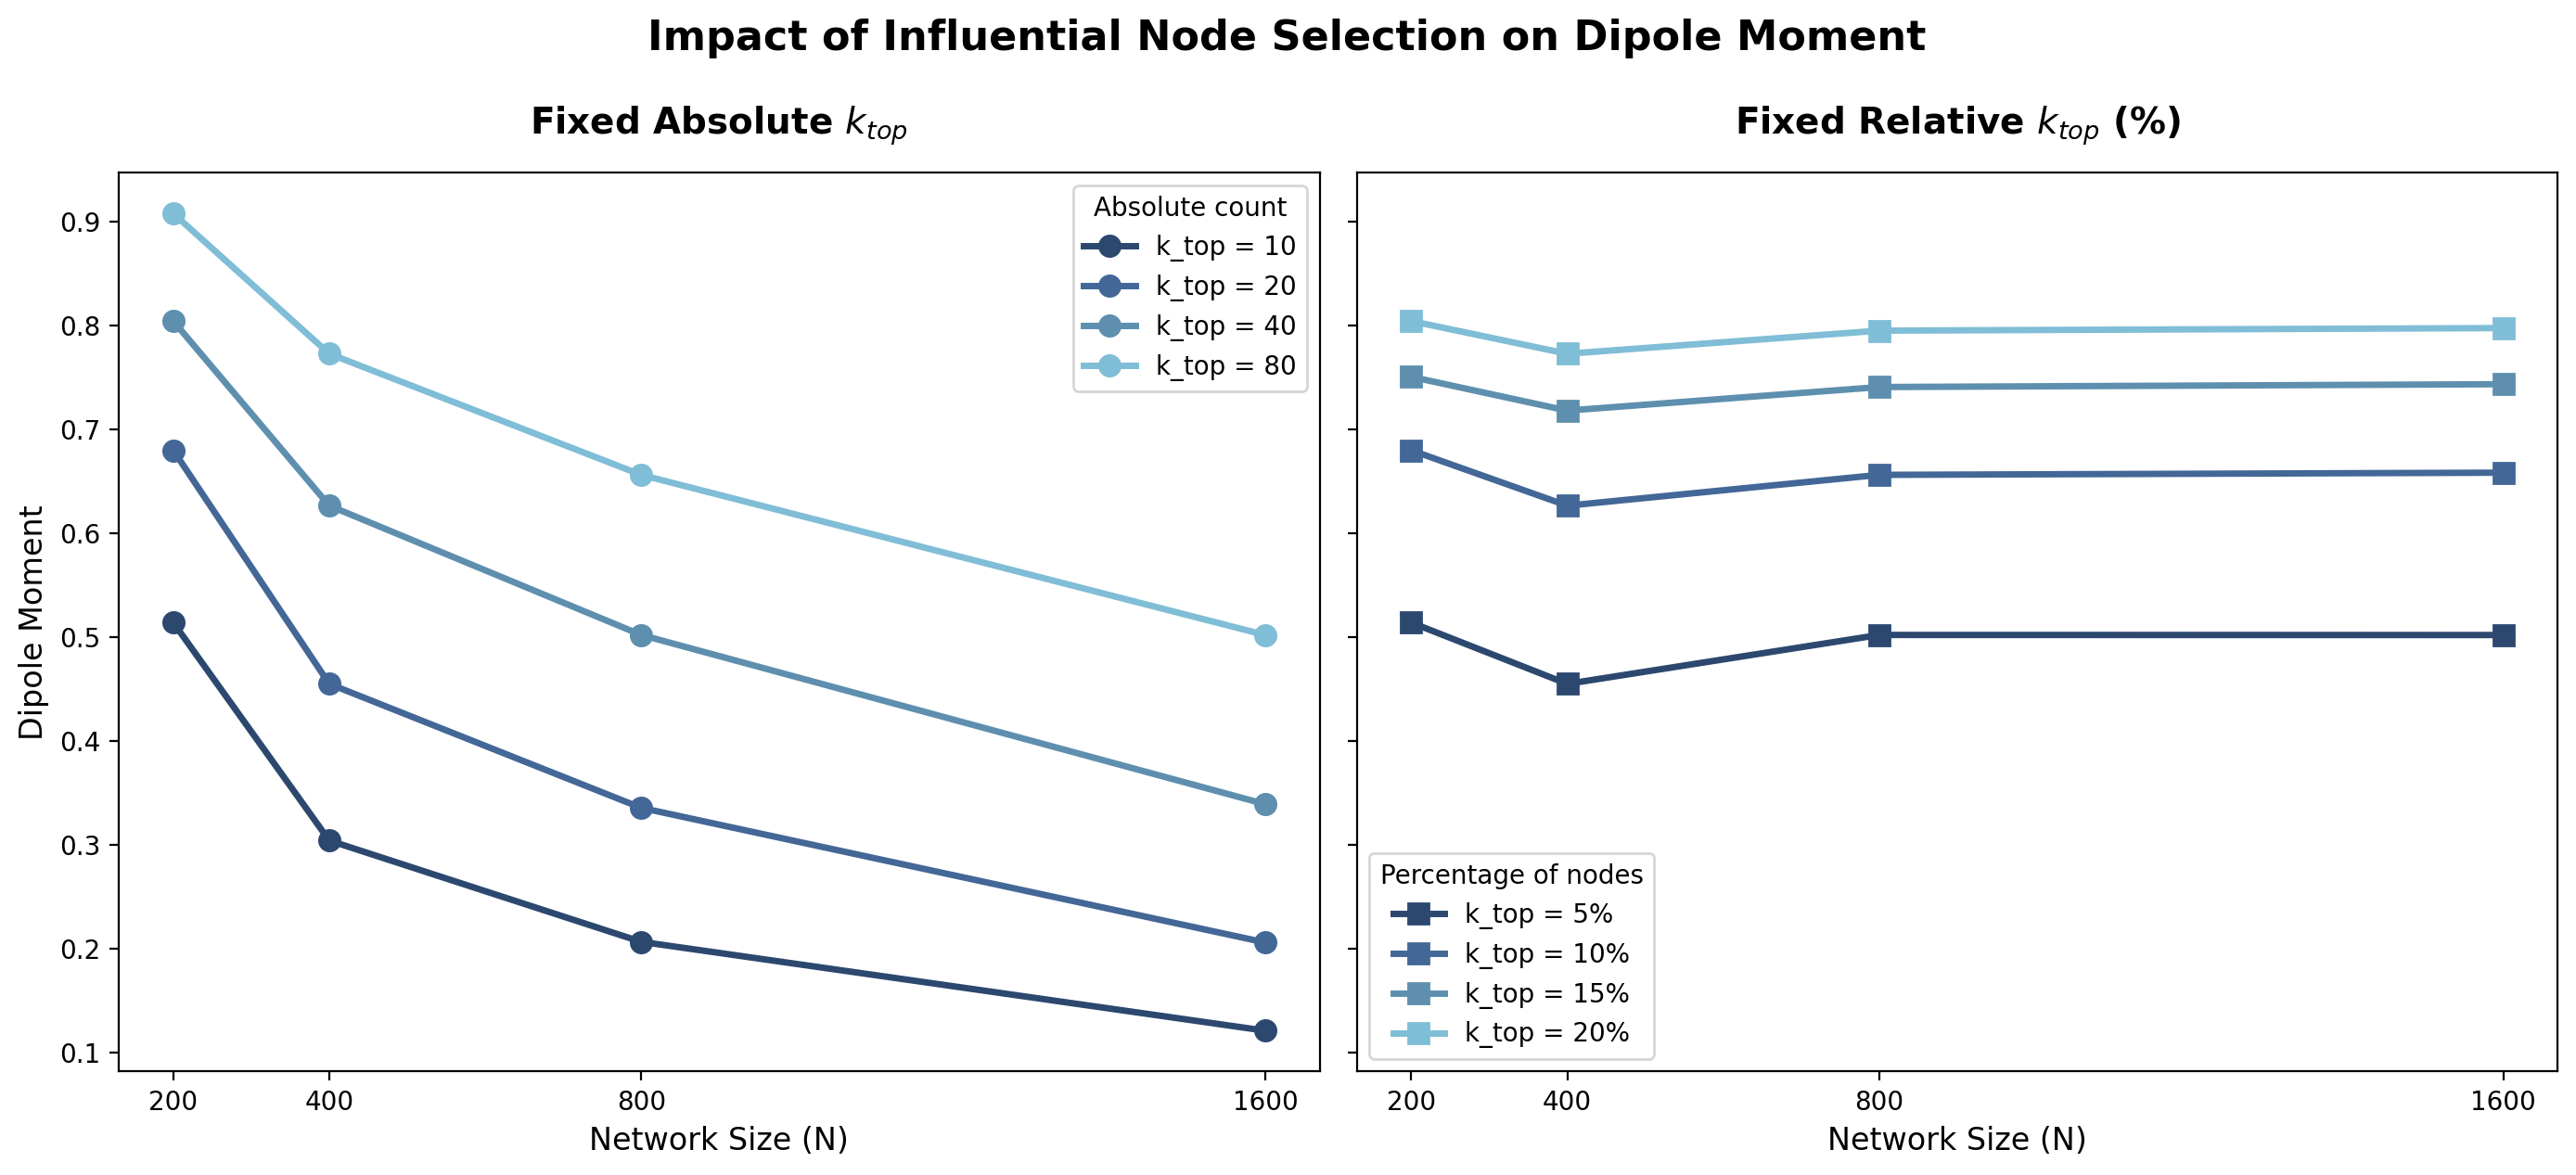
Dipole moment varies heavily with the parameter, k_top. *. If the influential nodes are not given manually, influential nodes will be calculated by their degree and k_top parameter. The parameter expects an integer value, indicating how many of the nodes will be considered as an influential node. If used with balanced is set to True, from each group \(\frac{k_{\text{top}}}{|M|}\) (\(|M|\) is the number of groups) nodes will be selected as influential nodes. If balanced is set to False, \(k_{\text{top}}\) highest degree nodes will be selected from the graph.
from netseg import dipole_moment
import igraph as ig
import warnings
import matplotlib.pyplot as plt
from matplotlib.colors import LinearSegmentedColormap, to_hex, Normalize, BoundaryNorm
import random
import numpy as np
from time import perf_counter
from mpl_toolkits.axes_grid1 import make_axes_locatable
from matplotlib.cm import ScalarMappable
import matplotlib.patches as mpatches

%config InlineBackend.figure_format = 'retina'

COLORS = [
    '#2C486F',
    '#436796',
    '#5E8FAE',
    '#80BDD6',
    '#B1DDE0',
    "#fdf8e7",
    '#F8E5B2',
    '#F3CF63',
    '#E9A64C',
    '#E3843B',
    '#DA584E'
 ]

def make_symmetric_sbm(p_in, p_out, n_groups, nodes_per_group, membership, **kwargs):
    pref_matrix = [
        [p_in if i == j else p_out for j in range(n_groups)]
        for i in range(n_groups)
    ]
    block_sizes = [nodes_per_group] * n_groups
    g = ig.Graph.SBM(pref_matrix, block_sizes, **kwargs)

    g.vs['membership'] = membership

    return g
Basic Usage
Most simple way to use netseg to calculate the dipole moment can be shown as following,
membership= [0 if i < 100 else 1 for i in range(200)]
random.seed(2)
g = make_symmetric_sbm(0.08, 0.004, 2, 100,membership, directed = True)
dipole_moment("membership", g, ego_included= True, k_top= 10, balanced= True)
np.float64(0.2893930981512981)
Notice that, we are using ego_included = True. As explained before, if this parameter is set to True, opinion of the ego node also included in the opinion propagation step. If set to False, only the neighbors are included. Although this does not change the results drastically, it can be altered according to your choice.
We are also setting the k_top parameter to \(10\) and balanced to True. As mentioned, if you do not provide influential nodes to dipole_moment, it will detect the influential nodes as highest degree nodes. If balanced is set to True, from each unqiue group k_top/ 2 nodes will be selected as influential nodes, if balanced is set to False, the highest k_top nodes will be selected as influential nodes, disregarding the group membership.
Picking Influential Nodes
There is no one size fits all selection for the influential nodes. Of course, depending on the context, influential nodes can be news sources, elites, etc. netseg provides using degree as influential node selection but also accepts and encourages using a list of integers to represent influential nodes.
If a list of influential nodes is not supplied directly, users should be aware that k_top parameter might vastly impact the results as can be seen in the following block.
network_sizes = [200, 400, 800, 1600]
absolute_k_tops = [10, 20, 40, 80]
relative_k_tops = [0.05, 0.10, 0.15, 0.20]

res_abs = {k: [] for k in absolute_k_tops}
res_rel = {k: [] for k in relative_k_tops}

random.seed(4)
np.random.seed(4)


with warnings.catch_warnings():
    warnings.simplefilter("ignore")
    for N in network_sizes:
        nodes_per_group = N // 2
        membership = [0 if i < nodes_per_group else 1 for i in range(N)]
        p_in = 16.0 / N
        p_out = 0.8 / N
        g = make_symmetric_sbm(p_in, p_out, 2, nodes_per_group, membership)
        for k in absolute_k_tops:
            if k >= N:
                res_abs[k].append(np.nan)
            else:
                score = dipole_moment(membership=membership, graph=g, ego_included=False, mode="out", k_top=k)
                res_abs[k].append(score)
        for pct in relative_k_tops:
            k = max(3, int(N * pct))
            if k >= N:
                res_rel[pct].append(np.nan)
            else:
                score = dipole_moment(membership=membership, graph=g, ego_included=False, mode="out", k_top=k)
                res_rel[pct].append(score)

fig, axes = plt.subplots(1, 2, figsize=(14, 6), sharey=True)

for idx, k in enumerate(absolute_k_tops):
    axes[0].plot(network_sizes, res_abs[k], marker='o', color=COLORS[idx], linewidth=2.5, markersize=8, label=f'k_top = {k}')
axes[0].set_title('Fixed Absolute $k_{top}$', fontsize=14, fontweight='bold', pad=15)
axes[0].set_xlabel('Network Size (N)', fontsize=12)
axes[0].set_ylabel('Dipole Moment', fontsize=12)
axes[0].set_xticks(network_sizes)
axes[0].legend(title='Absolute count', frameon=True)
for idx, pct in enumerate(relative_k_tops):
    axes[1].plot(network_sizes, res_rel[pct], marker='s', color=COLORS[idx], linewidth=2.5, markersize=8, label=f'k_top = {int(pct*100)}%')
axes[1].set_title('Fixed Relative $k_{top}$ (%)', fontsize=14, fontweight='bold', pad=15)
axes[1].set_xlabel('Network Size (N)', fontsize=12)
axes[1].set_xticks(network_sizes)
axes[1].legend(title='Percentage of nodes', frameon=True)
fig.tight_layout()
plt.suptitle('Impact of Influential Node Selection on Dipole Moment', fontsize=16, fontweight='bold', y=1.05)

plt.show()
References
Morales, Alfredo Jose, et al. “Measuring political polarization: Twitter shows the two sides of Venezuela.” Chaos: An Interdisciplinary Journal of Nonlinear Science 25.3 (2015).