Random Walk Controversy
Random Walk Controversy (RWC) evaluates network segregation by applying the concept of random walks on graphs (Garimella, 2018). The metric quantifies the disparity between the probability of interacting with content generated by an influential node within one’s own group versus a different group.
In its original formulation, RWC is defined as:
where:
Specifically, \(P_{AB}\) denotes the conditional probability that a random walk originated in partition \(A\), given that it terminated in partition \(B\). Assuming walks initiate from each partition with equal probability, the RWC score approaches 1 when intra-group content consumption heavily outweighs inter-group consumption, and 0 when content from either group is consumed with equal likelihood.
While RWC was initially designed for two groups, netseg extends the metric to support multi-group architectures and directed graphs using alternative calculation methods. Additionally, netseg provides the flexibility to manually designate influential nodes, rather than relying strictly on node degree.
Finally, please note that RWC is a stochastic method for quantification. Because netseg utilizes Monte Carlo simulations for the random walks, results may exhibit minor variance across runs. To ensure statistical robustness, it is advised to calculate the metric multiple times and compute the average before drawing any descriptive conclusions.
from netseg import random_walk_controversy
import igraph as ig
import numpy as np
import random
from time import perf_counter
import itertools

import matplotlib.pyplot as plt
from matplotlib.ticker import FormatStrFormatter
from matplotlib.colors import LinearSegmentedColormap, to_hex, Normalize, BoundaryNorm
import matplotlib.lines as mlines
from mpl_toolkits.axes_grid1 import make_axes_locatable
from matplotlib.cm import ScalarMappable
import matplotlib.patches as mpatches

%config InlineBackend.figure_format = 'retina'

COLORS = [
    '#2C486F',
    '#436796',
    '#5E8FAE',
    '#80BDD6',
    '#B1DDE0',
    "#fdf8e7",
    '#F8E5B2',
    '#F3CF63',
    '#E9A64C',
    '#E3843B',
    '#DA584E'
 ]

def make_symmetric_sbm(p_in, p_out, n_groups, nodes_per_group, membership, **kwargs):
    pref_matrix = [
        [p_in if i == j else p_out for j in range(n_groups)]
        for i in range(n_groups)
    ]
    block_sizes = [nodes_per_group] * n_groups
    g = ig.Graph.SBM(pref_matrix, block_sizes, **kwargs)

    g.vs['membership'] = membership

    return g
Basic Usage
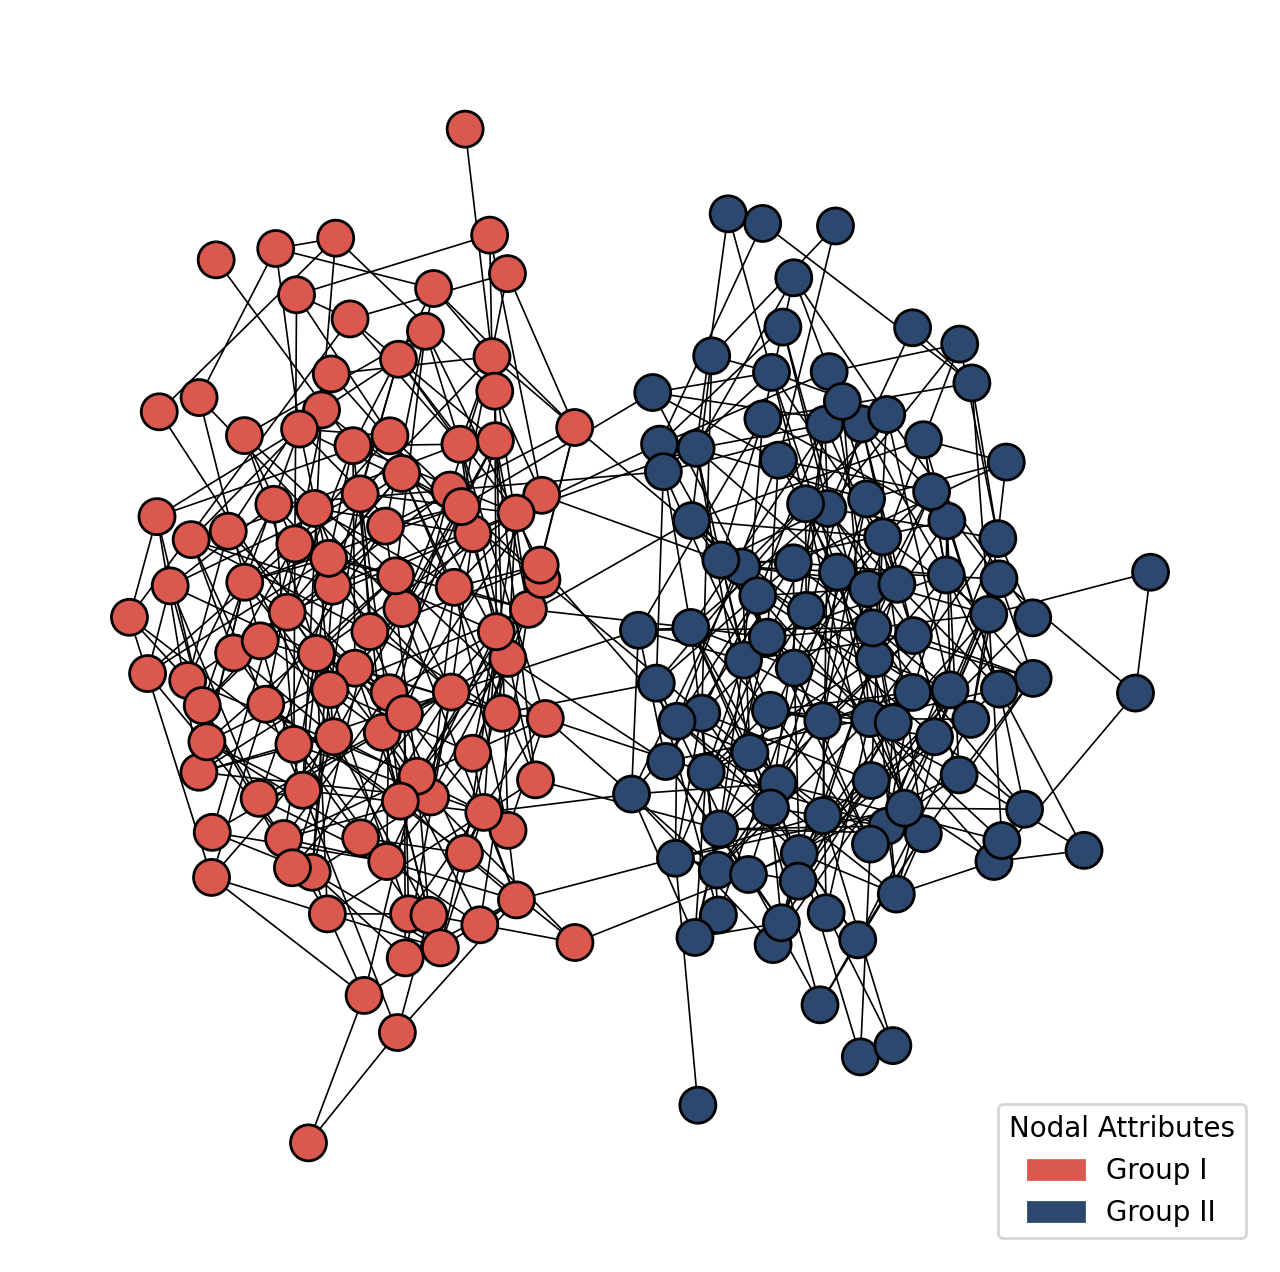
The most basic usage of the metric is using it on an undirected network with two groups.
random.seed(3)
membership_simple = [0 if i < 100 else 1 for i in range(200)]
g_simple = make_symmetric_sbm(0.06, 0.003, 2, 100, membership_simple)
g_simple_layout = g_simple.layout_kamada_kawai()

fig, ax = plt.subplots(figsize = (8,8))

ig.plot(g_simple,
        vertex_size = 36,
        edge_color = "black",
        edge_width = 0.6,
        vertex_color = [COLORS[-1] if i  == 1 else COLORS[0] for i in membership_simple],
        layout = g_simple_layout,
        target = ax)

g1 = mpatches.Patch(color = COLORS[-1], label = "Group I")
g2 = mpatches.Patch(color = COLORS[0], label = "Group II")

ax.legend(handles = [g1,g2], loc = "lower right", title = "Nodal Attributes")
plt.show()
rwc_score = random_walk_controversy("membership",
                                    g_simple,
                                    n_sim= 10000,
                                    maximum_walk_length= 20,
                                    k_top = 10,
                                    balanced= True)
print(rwc_score)
0.7694675430557305
UserWarning: 2336 walks out of 10000 never visited an influential node.
ig.Graph.write_gml(g_simple, "../test_rwc_network.gml")
The netseg provides several adjustable parameters for computing Random Walk Controversy:
n_sim: The number of random walk simulations to execute. The default value is 10,000, representing the total number of walkers traversing the network.maximum_walk_length: The maximum permitted length for a random walk. This parameter should be adjusted according to the network size. Although it was possible during development to force walkers to reach to an influential node with neighborhood selection in for loops,netsegavoids this approach due to Python interpreter overhead during iteration.netsegleverages the C backend of igraph to compute all walks in a single function call. Becauseigraphrequires a predefined walk length, this parameter is mandatory.netsegissues a warning if any walks terminate without visiting an influential node, and raises an error if all walks fail. Increasing this length can help ensure walkers reach an influential node in undirected, connected networks (note: in directed networks, walkers may still become trapped and never reach an influential node. In such cases increasing the walk length might not be a remedy).k_top and balanced: If the influential nodes are not given manually, influential nodes will be calculated by their degree andk_topparameter. The parameter expects an integer value, indicating how many of the nodes will be considered as an influential node. If used withbalancedis set toTrue, from each group \(\frac{k_{\text{top}}}{|M|}\) (\(|M|\) is the number of groups) nodes will be selected as influential nodes. Ifbalancedis set toFalse, \(k_{\text{top}}\) highest degree nodes will be selected from the graph.
Directed Graphs
netseg allows RWC to run in directed networks. In this case walkers will travel according to the given direction. Naturally, this might result in walkers getting stuck without reaching to any influential node. mode parameter sets the direction of the walk, if set to out, the natural direction of the graph will be followed. Set to in, walks would traverse the graph against the direction of the edges. Although out is more natural to use, there might be cases where in seems to be more logical, such as reply networks.
membership = [0 if i<100 else 1 for i in range(200)]
g_directed = make_symmetric_sbm(0.05, 0.005, 2, 100, membership, directed=True)

rwc_score_mode_in = random_walk_controversy("membership",
                        graph = g_directed,
                        n_sim= 10000,
                        maximum_walk_length= 100,
                        k_top= 10,
                        balanced= True,
                        mode = "in")
print(rwc_score_mode_in)
0.2856332697184513
UserWarning: 71 walks out of 10000 never visited an influential node.
Selecting Influential Nodes
netseg allows selecting influential nodes beyond the highest degree nodes. The interpretation of this might be context dependent. For example, if you would like to quantify the information flow across two friend groups and check how segregated they are you can supply certain nodes as influential nodes and quantify the segregation with RWC. To do this, you need to give a list of integers (graph indices) as influential nodes to the function.
g_inf_nodes= make_symmetric_sbm(0.08, 0.005, 2, 100, membership, directed=False)

rwc_score_inf_nodes = random_walk_controversy("membership",
                        graph = g_inf_nodes,
                        n_sim= 10000,
                        maximum_walk_length= 1000,
                        mode = "in",
                        influential_nodes=[65,67,88,93,112,139,149,180])
print(rwc_score_inf_nodes)
0.36803339184238887
Multiple Groups
To track where walks start and end, netseg builds an \(n \times n\) walk matrix (\(W\)), where rows represent starting groups and columns represent ending groups. Dividing each cell by its column sum yields the conditional probability matrix (\(C\)), where \(C_{ij}\) is the probability that a walk started in group \(i\), given that it ended in group \(j\).
To generalize RWC for any number of groups, netseg provides two distinct calculation methods:
1. Individual Method This approach gives a generalistic point of view regarding the signal flow in the network. It extends the canonical definition by multiplying all diagonal elements (the chances of staying in the same group) and subtracting the product of all off-diagonal elements (the chances of crossing between different groups):
2. One-vs-Other Method This approach is more generalized and robust to parameter selection. It treats each group as an isolate, creating \(2 \times 2\) walk matrices for each group against the rest of the network:
membership = []
for i in range(300):
  if i < 100:
    membership.append(0)

  elif i < 200:
    membership.append(1)

  else:
    membership.append(2)

random.seed(2)
g_multi = make_symmetric_sbm(0.05, 0.001, 3, 100, membership)

rwc_indv = random_walk_controversy("membership", g_multi, n_sim = 10000,
                              maximum_walk_length= 1000,
                              k_top= 5,
                              verbose = True,# We want report over the  walks
                              balanced = True,
                              calc_mode= "individual")
print(rwc_indv)
0.15009706835634154
rwc_ovso = random_walk_controversy("membership", g_multi, n_sim = 10000,
                              maximum_walk_length= 100,
                              k_top= 5,
                              verbose = True,# We want report over the  walks
                              balanced = True,
                              calc_mode= "ovso")
print(rwc_ovso)
0.5187734281148713
UserWarning: 1922 walks out of 10000 never visited an influential node.
Parameter Selection
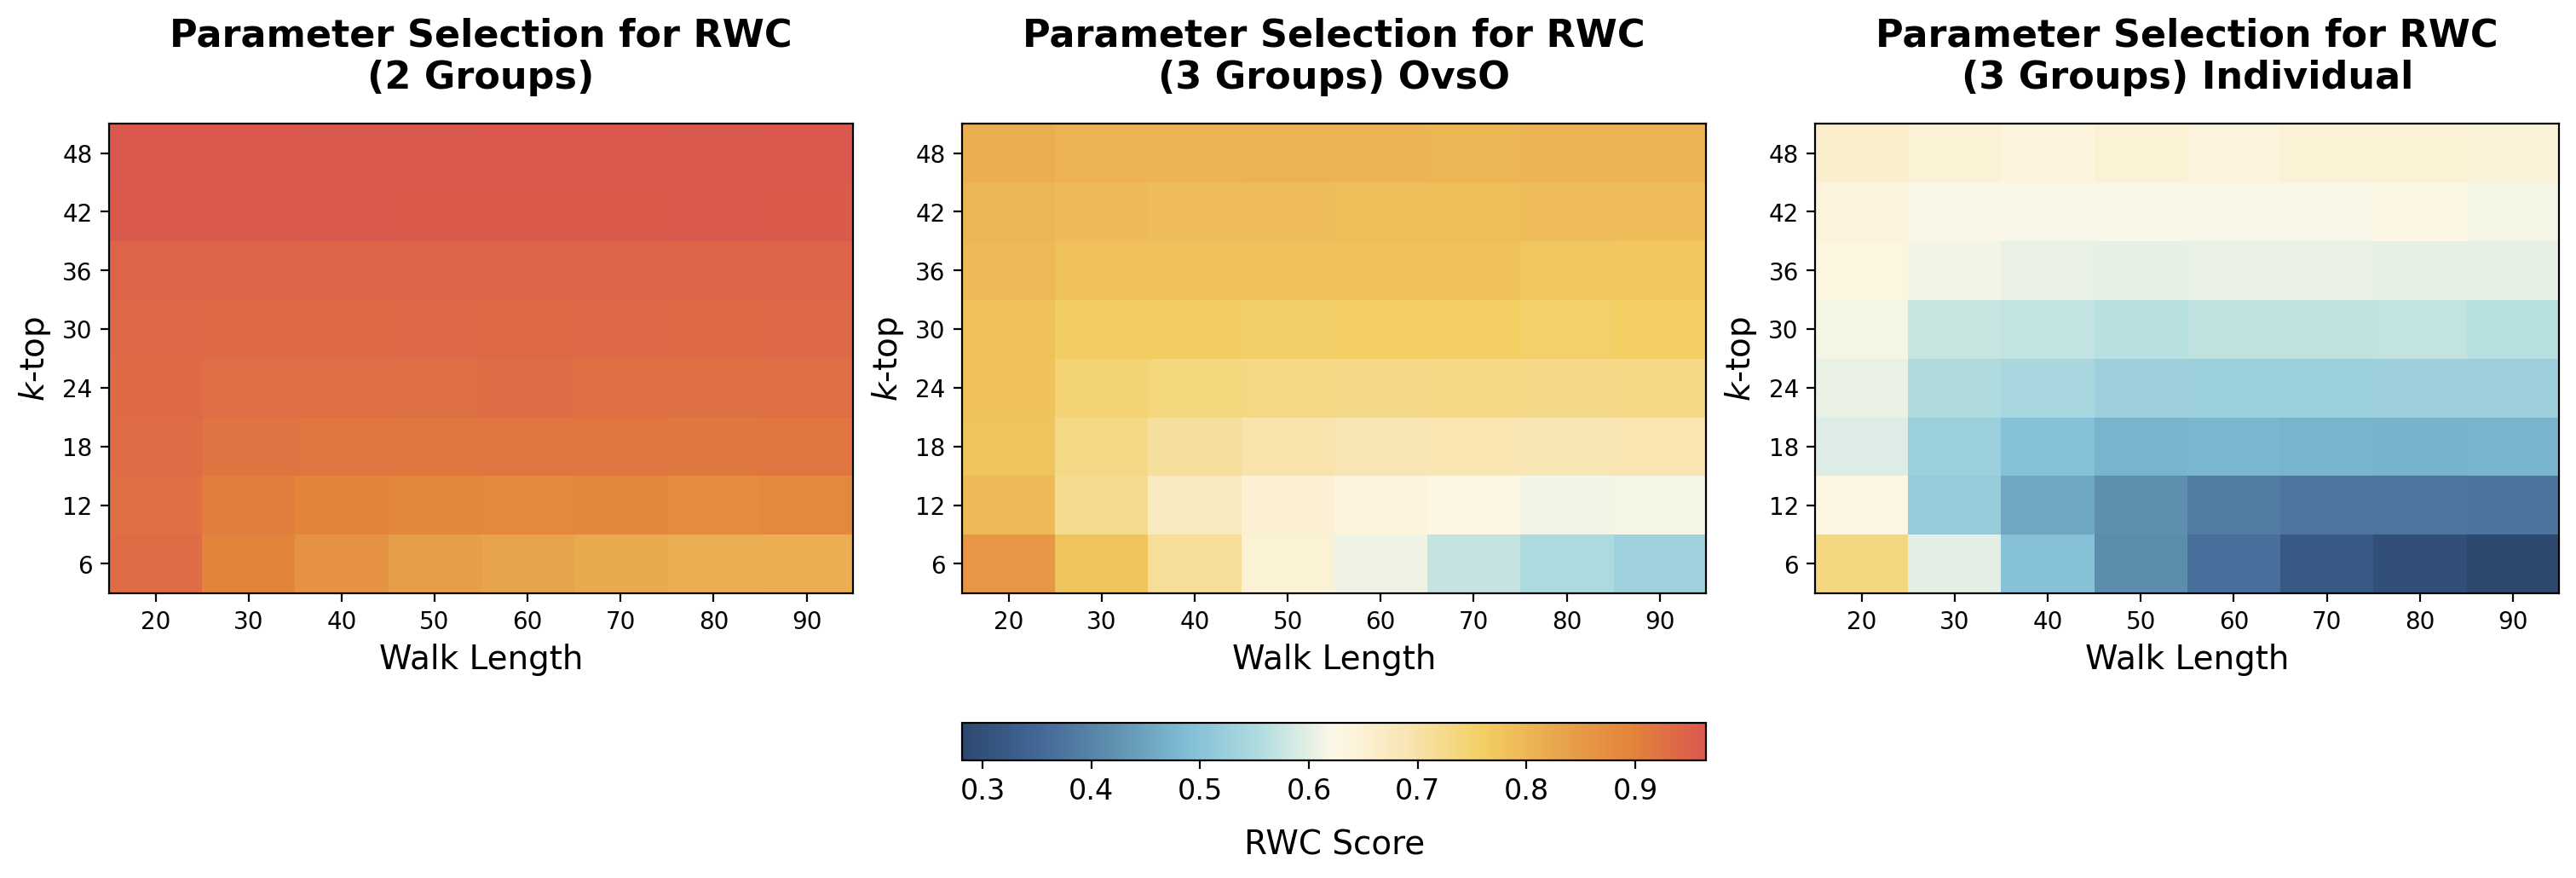
It is important to notice that parameter selection plays an important role for RWC, this is especially evident for multiple groups. Please notice that increasing the number of walks will increase the probability of reaching to an influential node for a walker.
g = make_symmetric_sbm(0.05, 0.001, 2, 100, [0 if i < 100 else 1 for i in range(200)])
custom_cmap = LinearSegmentedColormap.from_list("custom_cmap", COLORS)

ktops = np.arange(6, 52, 6)
walk_lengths = np.arange(20, 100, 10)

def run_simulation(graph, w_len, k, calc_mode=None):
    scores = []
    for _ in range(5):
        try:
            params = {
                "membership": "membership",
                "graph": graph,
                "n_sim": 10000,
                "maximum_walk_length": int(w_len),
                "k_top": k,
                "balanced": True,
                "verbose": False
            }
            if calc_mode:
                params["calc_mode"] = calc_mode

            scores.append(random_walk_controversy(**params))
        except Exception as e:
            print(e)

    return np.mean(scores) if scores else np.nan

rwc_s2, rwc_b2_ind, rwc_b2_ovso = [], [], []

for k, w_len in itertools.product(ktops, walk_lengths):
    rwc_s2.append(run_simulation(g, w_len, k))
    rwc_b2_ovso.append(run_simulation(g_multi, w_len, k, calc_mode="ovso"))
    rwc_b2_ind.append(run_simulation(g_multi, w_len, k, calc_mode="individual"))

grid_shape = (len(ktops), len(walk_lengths))
arrays = [
    np.array(rwc_s2).reshape(grid_shape),
    np.array(rwc_b2_ovso).reshape(grid_shape),
    np.array(rwc_b2_ind).reshape(grid_shape)
]
vmin = min(arr.min() for arr in arrays)
vmax = max(arr.max() for arr in arrays)

fig, axs = plt.subplots(1, 3, figsize=(15, 5), constrained_layout=True)

titles = [
    'Parameter Selection for RWC\n(2 Groups)',
    'Parameter Selection for RWC\n(3 Groups) OvsO',
    'Parameter Selection for RWC\n(3 Groups) Individual'
]

for ax, arr, title in zip(axs, arrays, titles):
    im = ax.imshow(arr, cmap=custom_cmap, vmin=vmin, vmax=vmax, aspect='auto')
    ax.set_title(title, fontsize=16, fontweight="bold", pad=15)
    ax.set_yticks(range(len(ktops)), ktops)
    ax.set_xticks(range(len(walk_lengths)), walk_lengths)
    ax.set_xlabel('Walk Length', fontsize=14)
    ax.set_ylabel(r'$k$-top', fontsize=14)
    ax.invert_yaxis()

cbar = fig.colorbar(im, ax=axs[1], orientation="horizontal", fraction=0.2, pad=0.08)
cbar.set_label('RWC Score', fontsize=14, labelpad=10)
cbar.ax.tick_params(labelsize=12)

plt.show()
Number of Simulations
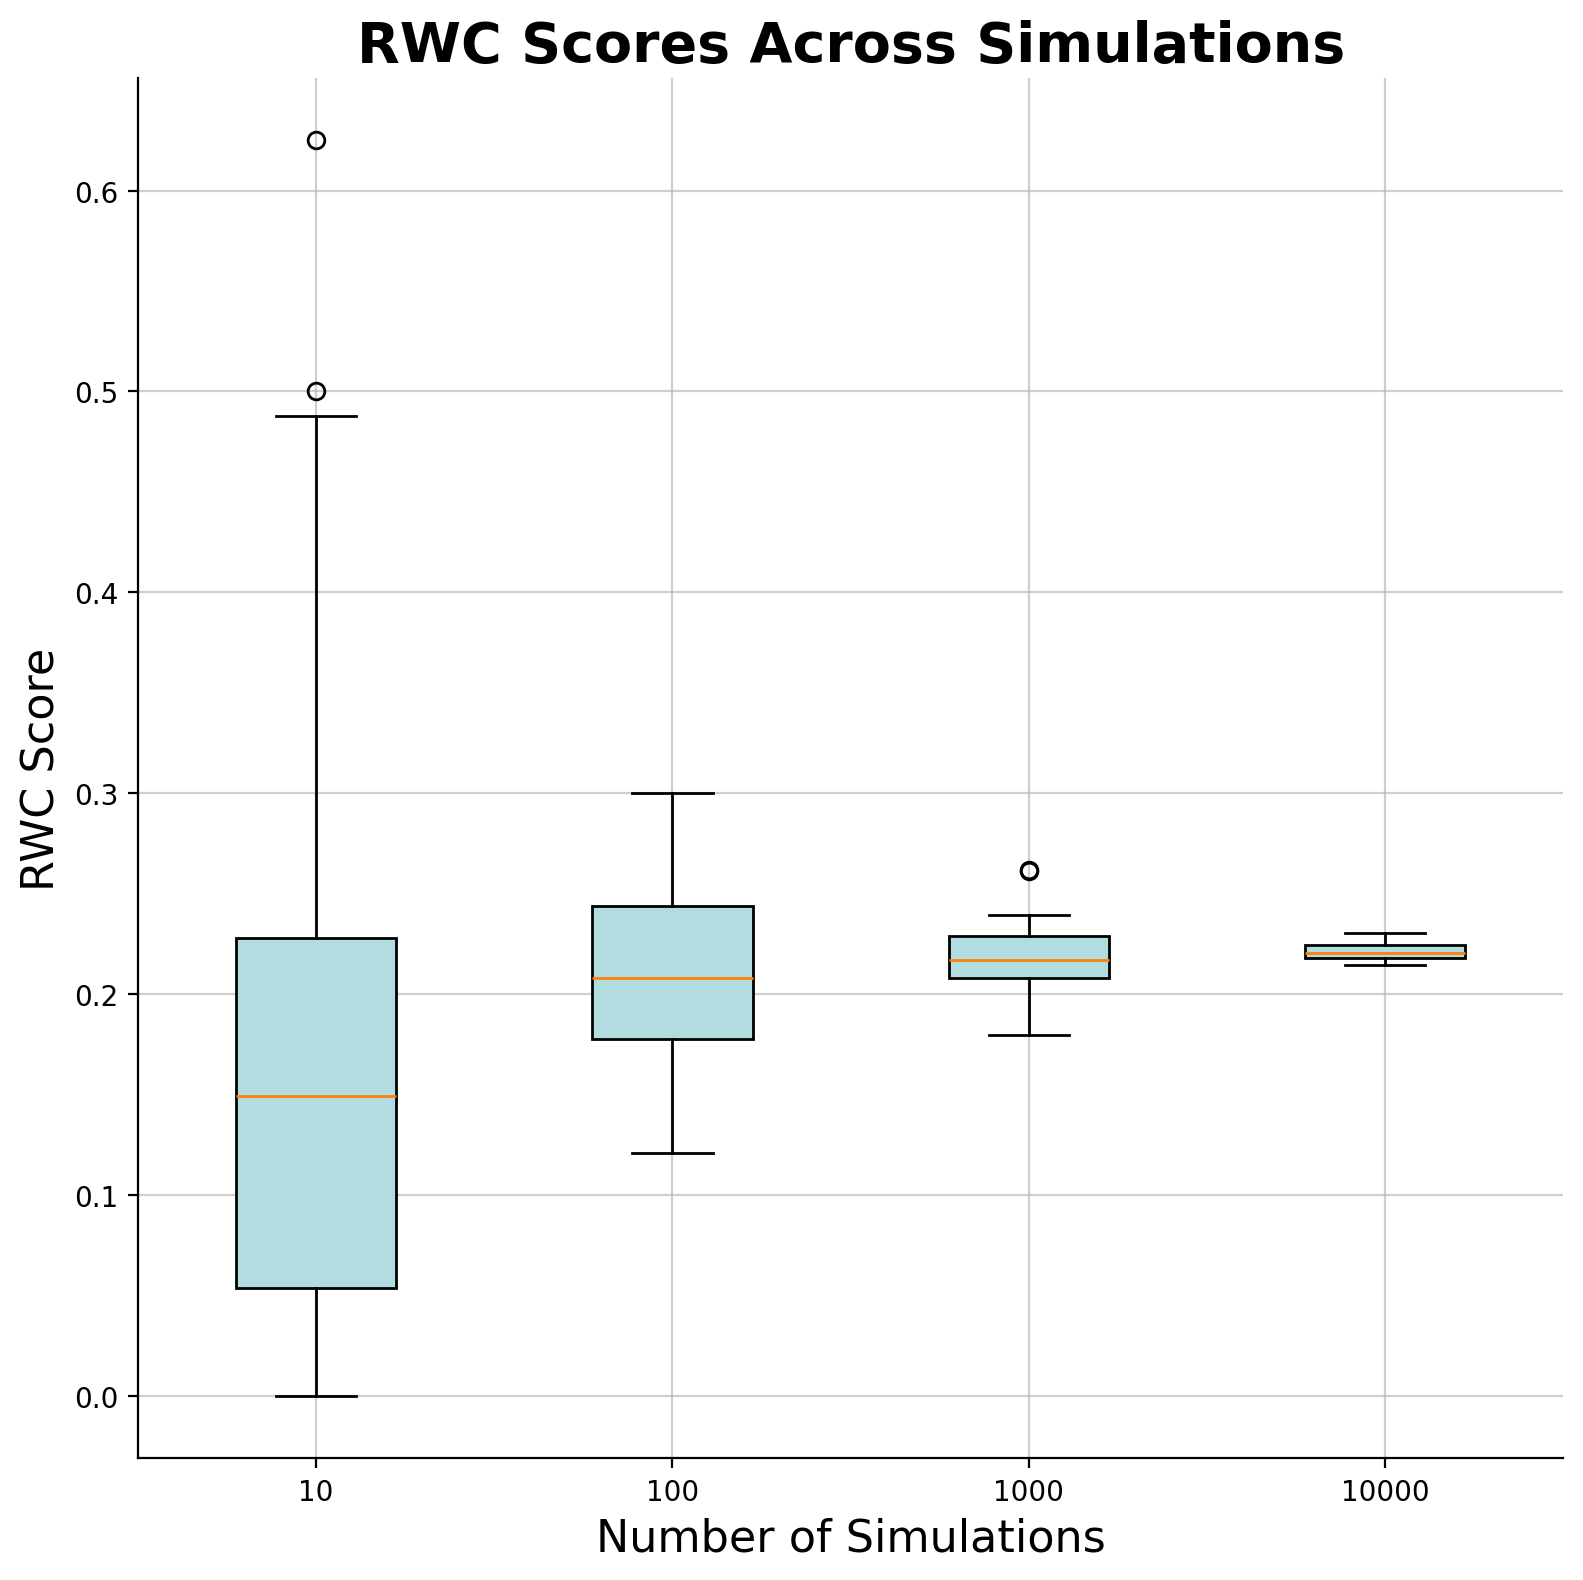
Increasing the number of simulations is almost always a good idea. This will increase the runtime of the calculation but results might not be reliable otherwise.
g_sim = make_symmetric_sbm(0.12, 0.004, 2, 200, membership= [0 if i < 100 else 1 for i in range(200)])

rwc_10 = []
rwc_100 = []
rwc_1000 = []
rwc_10000 = []

for __ in range(30):
  rwc_10.append(random_walk_controversy("membership", g_sim, n_sim = 10, k_top = 10, balanced = True, maximum_walk_length= 10000))
  rwc_100.append(random_walk_controversy("membership", g_sim, n_sim = 100, k_top = 10, balanced = True, maximum_walk_length= 10000))
  rwc_1000.append(random_walk_controversy("membership", g_sim, n_sim = 1000, k_top = 10, balanced = True, maximum_walk_length= 10000))
  rwc_10000.append(random_walk_controversy("membership", g_sim, n_sim = 10000, k_top = 10, balanced = True, maximum_walk_length= 10000))
fig, ax = plt.subplots(figsize=(8, 8))

data = [rwc_10, rwc_100, rwc_1000, rwc_10000]
labels = ["10", "100", "1000", "10000"]

bplot = ax.boxplot(data, tick_labels=labels, patch_artist=True, boxprops=dict(facecolor=COLORS[4]))

ax.set_xlabel("Number of Simulations", fontsize = 16)
ax.set_ylabel("RWC Score", fontsize = 16)
ax.set_title("RWC Scores Across Simulations", fontsize = 20, fontweight = "bold")
ax.grid(True, alpha = .6)
ax.spines['right'].set_visible(False)
ax.spines['top'].set_visible(False)
fig.tight_layout()
plt.show()
Example
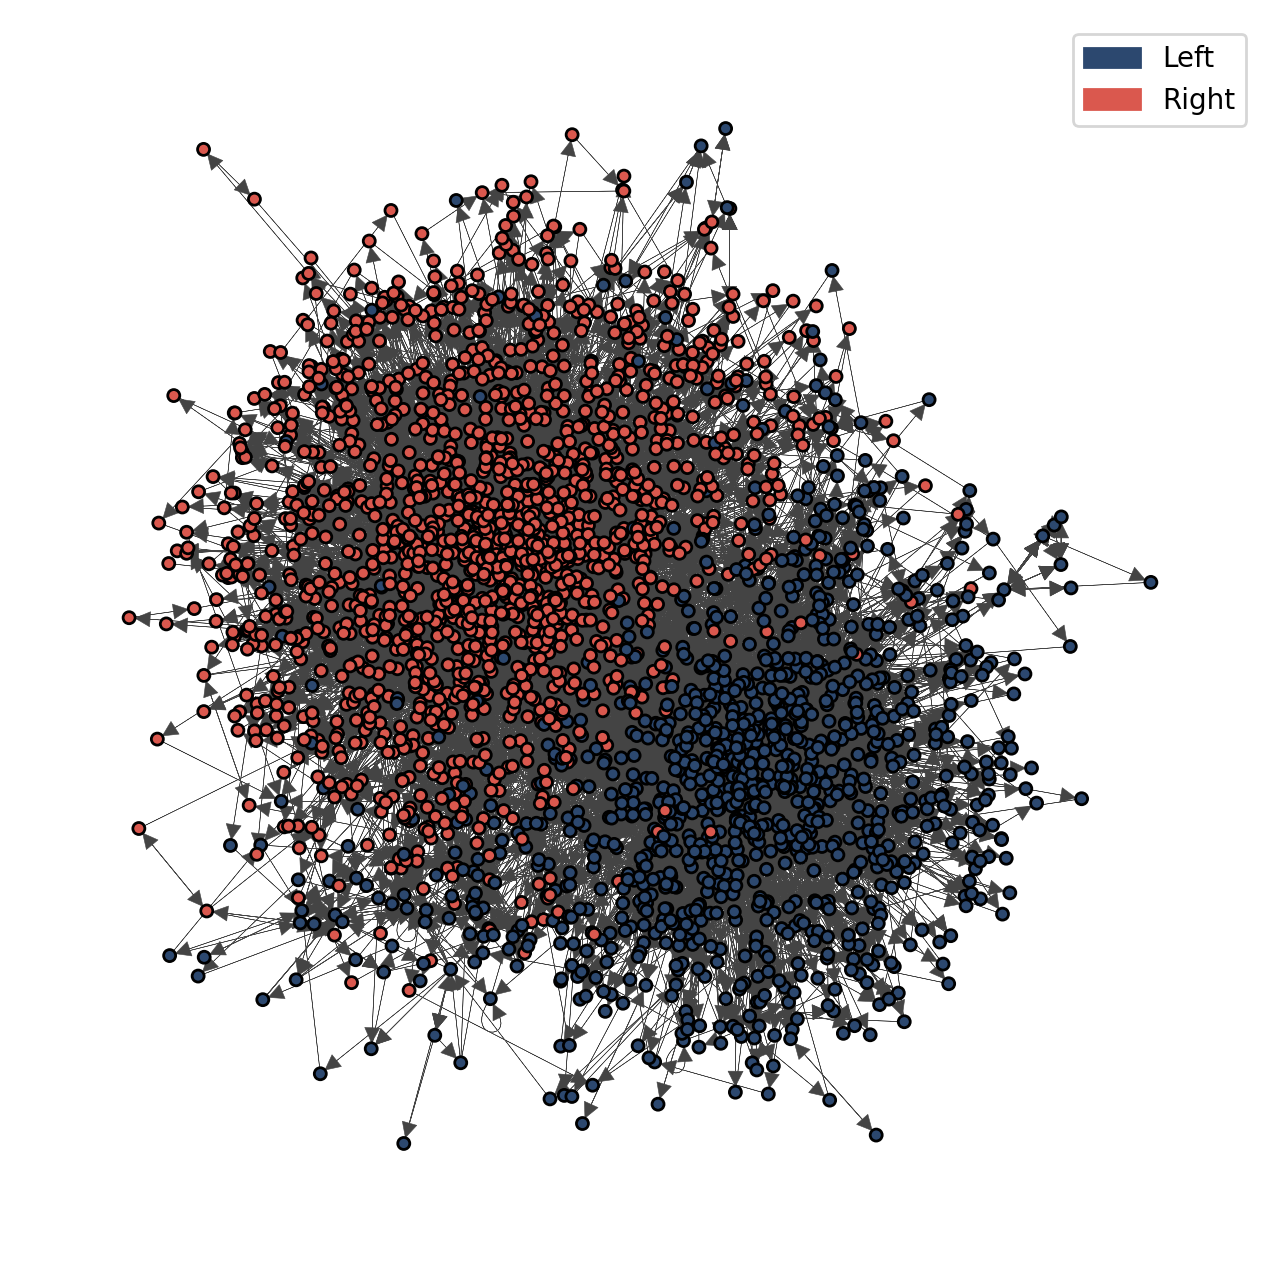
We use the “2010 Congressional Midterm Twitter” dataset to demonstrate the RWC. Edges indicate political communication, specifically retweets between users on the platform. We measure the structural polarization with the nodal attribute representing political opinion (categorized as Left or Right). For this analysis, we focus on the largest weakly connected component and take the subgraph where users’ opinions are not null. Original dataset can be found here.
g_example = ig.Graph.Read_GML('../assets/twitter/twitter.gml')
g_example = g_example.components().giant()
g_example = g_example.subgraph(np.where(np.array(g_example.vs['cluster']) != "-")[0])
fig, ax = plt.subplots(figsize = (8,8))
ig.plot(g_example,
        layout = g_example.layout_fruchterman_reingold(),
        vertex_size = 12,
        edge_width = .2,
        vertex_color = [COLORS[0] if i == "left" else COLORS[-1] for i in g_example.vs['cluster']],
        target = ax)
l1 = mpatches.Patch(color = COLORS[0], label = "Left")
l2 = mpatches.Patch(color = COLORS[-1], label = "Right")
ax.legend(handles = [l1,l2])
plt.show()
rwc_score = random_walk_controversy("cluster", g_example, mode = "out", n_sim= 10000, k_top= 20, balanced= True)
print(rwc_score)
0.2427416743220281
UserWarning: 8154 walks out of 10000 ended prematurely. This might indicate that the graph is not connected or some walkers got stuck. See documentation for more details. RWC will be calculated with completed walks
The above warning is completely normal, since the graph is directed walkers got stuck and terminate prematurely before the maximum walk limit. 2000 samples are still relatively good for calculation.
References
Garimella, Kiran, et al. “Quantifying controversy on social media.” ACM Transactions on Social Computing 1.1 (2018): 1-27.