Odds Ratio for Within Group Ties
Odds Ratio for Within group Ties (ORWG) (Moody, 2001) calculates the odds ratio for tie existence versus non-existence for within-group dyads and between-group dyads (Bojanowski, 2014). It can be calculated as,
where \(m_{ab1}\) represents realized cross group ties between a and b (or within group ties if \(a = b\)) and \(m_{ab0}\) represents cross group ties that could not be realized between the groups \(a\) and \(b\) (or within the groups if \(a=b\)). The metric can easily be extended for multiple groups with
from netseg import orwg
import igraph as ig
import matplotlib.pyplot as plt
from matplotlib.colors import LinearSegmentedColormap, to_hex, Normalize, BoundaryNorm
import random
import numpy as np
from time import perf_counter
from mpl_toolkits.axes_grid1 import make_axes_locatable
from matplotlib.cm import ScalarMappable
import matplotlib.patches as mpatches

%config InlineBackend.figure_format = 'retina'

COLORS = [
    '#2C486F',
    '#436796',
    '#5E8FAE',
    '#80BDD6',
    '#B1DDE0',
    "#fdf8e7",
    '#F8E5B2',
    '#F3CF63',
    '#E9A64C',
    '#E3843B',
    '#DA584E'
 ]

def make_symmetric_sbm(p_in, p_out, n_groups, nodes_per_group, membership, **kwargs):
    pref_matrix = [
        [p_in if i == j else p_out for j in range(n_groups)]
        for i in range(n_groups)
    ]
    block_sizes = [nodes_per_group] * n_groups
    g = ig.Graph.SBM(pref_matrix, block_sizes, **kwargs)

    g.vs['membership'] = membership

    return g

def get_custom_colors_hex(values):
    vmin = min(values)
    vmax = max(values)

    norm = Normalize(vmin=vmin, vmax=vmax)
    custom_cmap = LinearSegmentedColormap.from_list("custom_gradient", COLORS)

    return [to_hex(custom_cmap(i)) for i in norm(values)]
Basic Usage
You can directly use the function orwg to calculate the odds-ratio for within group ties.
membership= [0 if i < 100 else 1 for i in range(200)]
random.seed(2)
g = make_symmetric_sbm(0.04, 0.004, 2, 100,membership)
orwg_score = orwg("membership", g)
print(orwg_score)
2.5622742209555844
Multiple Groups
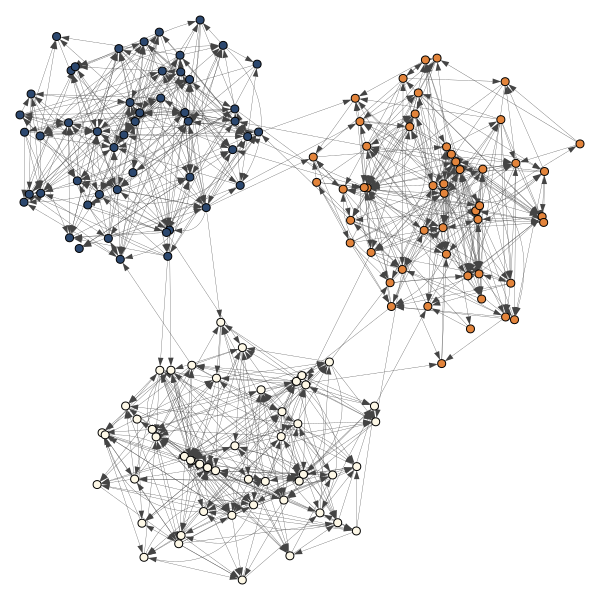
Extended version of the score can be applied to multiple groups.
membership_multiple = []
for i in range(150):
  if i < 50:
    membership_multiple.append("foo")
  elif i < 100:
    membership_multiple.append("bar")
  else:
    membership_multiple.append("baz")

colors_dict = {"foo":0, "bar":9, "baz":5}
random.seed(4)
g_multiple = make_symmetric_sbm(0.1, 0.001, 3, 50, membership_multiple, directed = True)

ig.plot(g_multiple, vertex_size = 8, edge_arrow_size = .6, edge_width = .3, layout = g_multiple.layout_kamada_kawai(), vertex_color = [COLORS[colors_dict[i]] for i in membership_multiple])
orwg_score_multiple= orwg("membership", g_multiple)
print(orwg_score_multiple)
4.514503773994705
Example
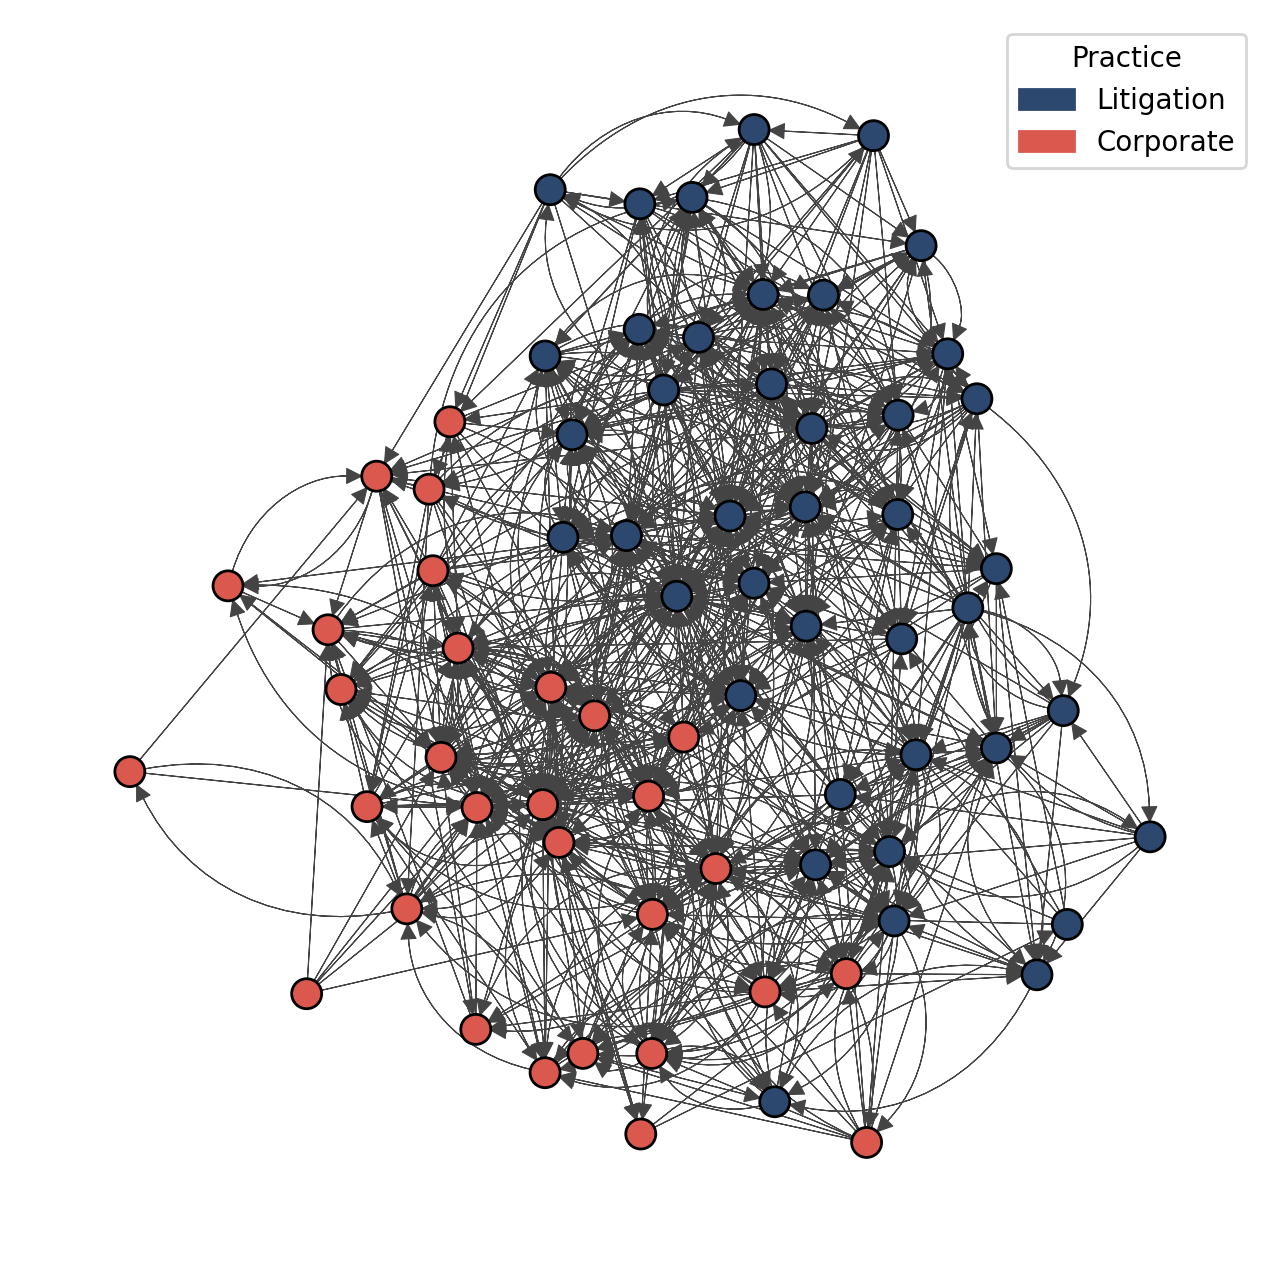
We use the “Lazega Lawyers” dataset to demonstrate the ORWG. Edges indicate seeking advice from a colleague in a corporate law firm. We measure the segregation with the nodal attribute “practice” (e.g., litigation or corporate). Original dataset can be found here.
g_example = ig.Graph.Read_GML('../assets/law_advice/law_advice.gml')
fig, ax = plt.subplots(figsize = (8,8))
random.seed(2)
ig.plot(g_example,
        layout = g_example.layout_kamada_kawai(),
        vertex_color = [COLORS[0] if i == 1 else COLORS[-1] for i in g_example.vs['practice']],
        target = ax,
        edge_width = 0.4)

lit_patch = mpatches.Patch(color = COLORS[0], label = "Litigation")
corp_patch = mpatches.Patch(color = COLORS[-1], label = "Corporate")
ax.legend(handles= [lit_patch, corp_patch], title = "Practice")
plt.show()
orwg_score_lawyers = orwg("practice", g_example)
print(orwg_score_lawyers)
1.2382442313286368
References
Bojanowski, M., & Corten, R. (2014). Measuring segregation in social networks. Social networks, 39, 14-32.
Moody, James. “Race, school integration, and friendship segregation in America.” American Journal of Sociology 107.3 (2001): 679-716.